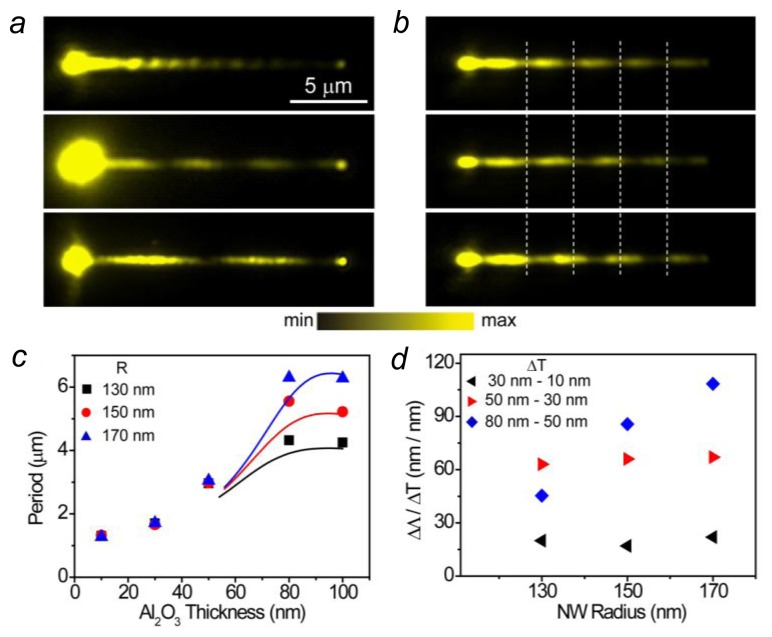
Figure 5.
(a) QD emission images for a 155 nm radius NW coated with 15 nm of Al2O3 and QDs measured in air (Top), water (Middle), and oil (Bottom); (b) QD emission images for a 162 nm radius NW with a 50 nm Al2O3 coating measured in air (Top), and then after depositing 5 nm of Al2O3 (Middle), and finally with an additional 5 nm of Al2O3 (Bottom). The white dashed lines are visual guides to show the shift of the plasmon near-field pattern. Scale bar in (a) is for (b) as well; (c) The beat period as a function of Al2O3 coating thickness. The dots are experimental data, and the lines are calculated data; (d) The period change per nanometer of Al2O3 as a function of the nanowire radius (Adapted from [42]).

