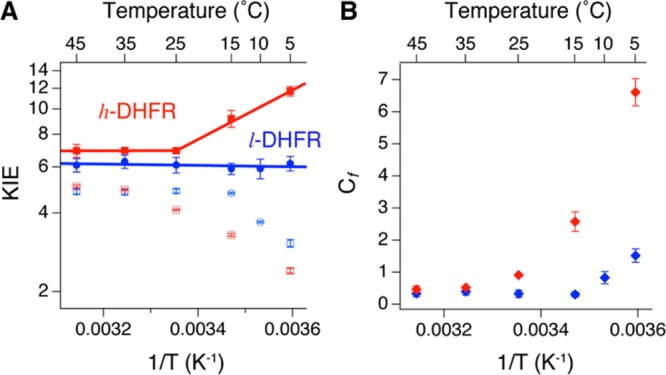
Figure 4.

KIEs and forward commitment factors (Cf) of l-DHFR (blue, data from ref (31)) and h-DHFR (red) measured from competitive experiments at pH 9. (A) The observed H/T KIEs on kcat/KMNADPH (empty symbols) and intrinsic H/T KIEs (Tkhyd, filled symbols) are plotted on the logarithmic scale against inverse absolute temperature. The lines are nonlinear regression of Tkhyd to the Arrhenius equation (eq 2). (B) Cf of h-DHFR is either statistically equal to (25–45 °C) or larger than (5–25 °C) Cf of l-DHFR.
