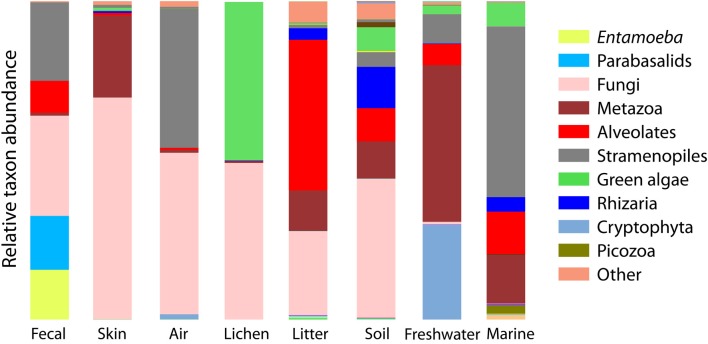
Figure 3.
Bar chart of the relative abundance of sequences falling into the major clades of eukaryotes depicts the overall divergence in community composition across sample types. Major clades are the deepest divisions within eukaryotes (Parfrey et al., 2010; Adl et al., 2012) and are roughly equal to the phyla or superphyla level of bacteria.

