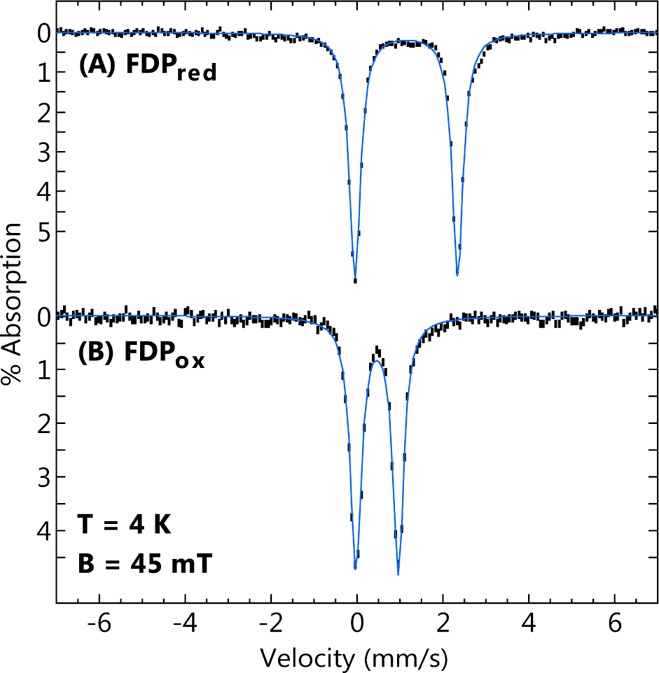
Figure 2.

Mössbauer spectra (black bars) of (A) FDPred and (B) FDPox recorded at 4.2 K in a magnetic field of 45 mT applied parallel to the γ-ray direction. The blue lines are Lorentzian fits with parameters listed in Table 1. The samples were prepared as described in Experimental Procedures.
