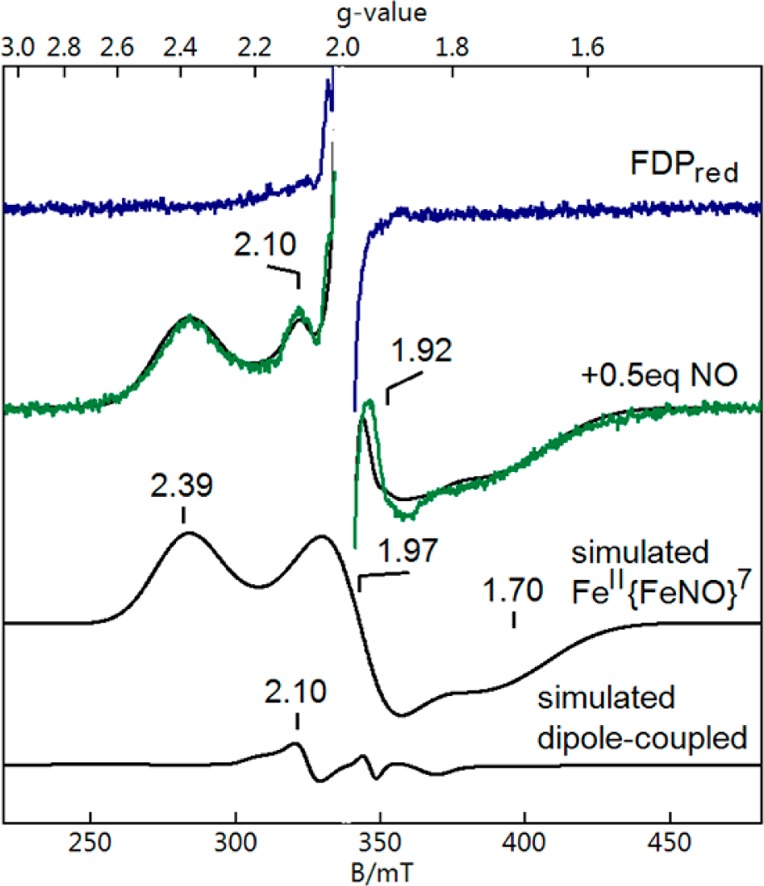
Figure 4.

RFQ EPR spectra of FDPred (blue spectrum) and 200 ms after mixing FDPred with ∼0.5 equiv of NO at 4 °C (green spectrum). Simulated spectra are shown as black traces. The black trace overlaying the green spectrum is the sum of “simulated FeII{FeNO}7” and “simulated dipole-coupled” between a minor portion (<3%) of FeII{FeNO}7 and FMNsq at a distance of 4.5 Å. The g = 1.92 indicates a small amount of free NO. A radical species (<1%) at g = 2.0 attributed to FMNsq has been clipped in both experimental spectra. Conditions immediately after mixing: 250 μM FDPred and 130 μM NO in 50 mM MOPS, pH 7.3. Instrumental parameters: microwaves, 9.645 GHz, 0.26 mW; temperature, 4 K.
