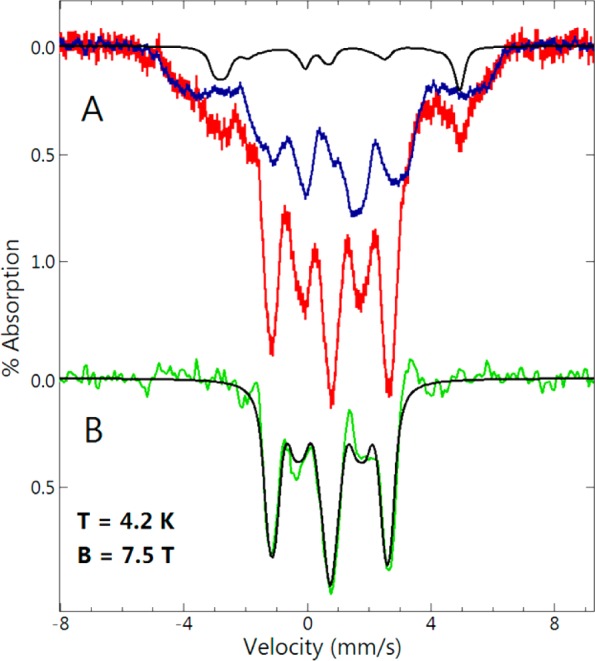
Figure 8.

(A) 57Fe Mössbauer spectra (temperature, 4 K; magnetic field, 7.5 T) of (red bars) of RFQ mixed FDPred with ∼3 equiv of NO per active site at ∼15 °C and quenched at 200 ms (the same 200 ms sample used for Figure 7), and (blue bars) FDPred + 2 equiv of NO from the titration series of Figure 5, displayed at 59% of the area of the red spectrum. The black line in (A) is a simulation for S = 3/2, D = 15 cm–1, E/D = 0.02, Aiso = −25 T, δ = 0.65 mm/s, ΔEq = −1.9 mm/s, η = 0.4, 6% of area of red spectrum. (B) The green line is the difference of the three spectra in A (red minus blue minus black). The black line is a simulation for S = 0, δ = 0.77 mm/s, ΔEq = 1.85 mm/s, η = 1, 37% of area of red spectrum.
