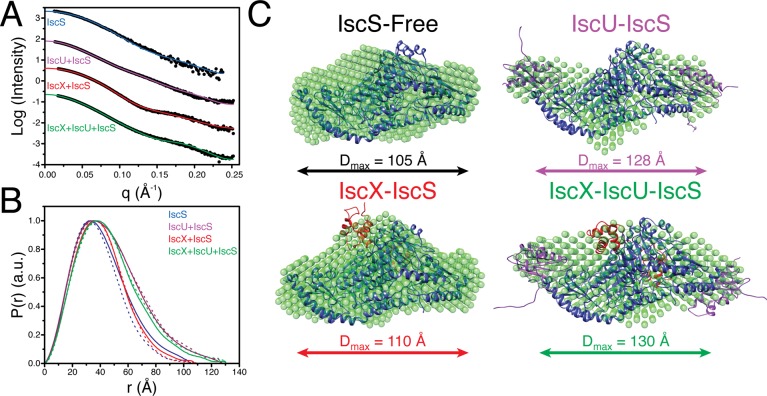
Figure 2.
Structural models from SAXS data. (A) Experimental SAXS data (circles) recorded for IscS (blue), IscU + IscS (purple), IscX + IscS (red), and IscX + IscU + IscS (green). Fits of the molecular models for IscS (PDB 1P3W) and those determined from rigid-body modeling to experimental SAXS are plotted as solid lines. (B) Pairwise distance distribution functions derived from experimental SAXS data (solid-lines) for IscS (blue), IscU + IscS (purple), IscX + IscS (red), and IscX + IscU + IscS (green) compared to those derived from the rigid-body modeling derived structures (dashed-lines). (C) Molecular models of IscS (black, PDB 1P3W), IscU–IscS (purple), IscX–IscS (red), and IscX–IscU–IscS (green) determined from rigid-body modeling simulations. The structures used for each complex component in the rigid-body modeling simulations were: IscS (blue; PDB 1P3W),32 IscU (purple; PDB 2L4X),33 and IscX (red; PDB 2BZT).17 The resulting structures from rigid-body modeling are overlaid with ab initio shape models determined from the SAXS data with DAMMIF.24

