Figure 3.
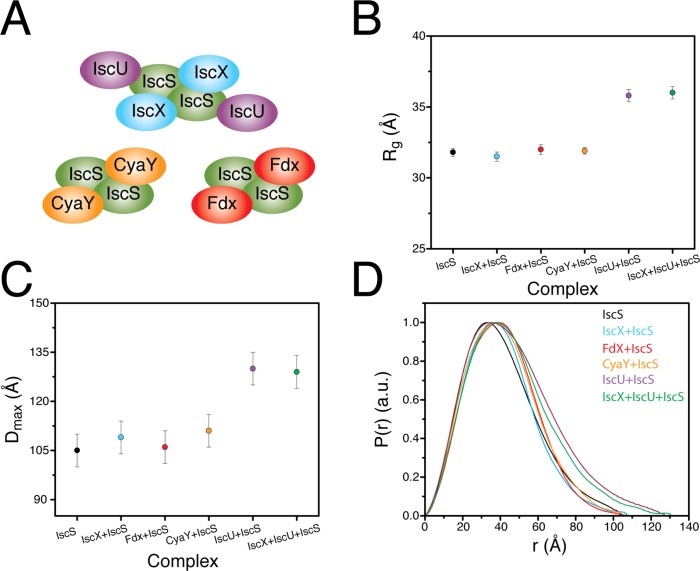
Comparison of results from SAXS experiments for several complexes involving IscS. (A) Cartoon representations of the IscX–IscS, IscU–IscS, Fdx–IscS,8 CyaY–IscS,15 and IscX–IscU–IscS complexes. (B) Experimentally determined radius of gyration for IscS and the complexes depicted in A. (C) Experimentally determined Dmax for IscS and the complexes depicted in A. (D) Distance distribution functions determined from experimental SAXS data from IscS and the complexes depicted in A.

