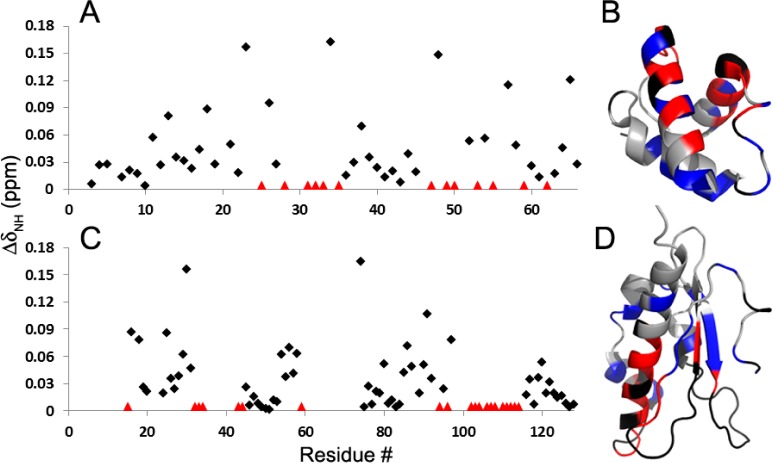
Figure 5.
NMR evidence for the surfaces by which IscX and IscU interact. (A) Perturbation of the 15NH-1HN signals (ΔδNH) of [U-15N]-IscX, resulting from the addition of 4 equiv of IscU. Red triangles denote residues whose chemical shift changes could not be followed because of severe line broadening. (B) Results from panel A mapped onto the structure of IscX (PDB 2BZT)17 with the following color code: gray, not affected; blue, significantly shifted (ΔδNH > 0.04 ppm); red, broadened; black, not assigned or overlapped. (C) Perturbation of the 15NH-1HN signals of [U-15N]-IscU resulting from the addition of 4 equiv IscX. Red triangles denote residues whose chemical shift changes could not be followed because of severe line broadening. (D) Results from panel C mapped onto the structure of IscU (PDB 2L4X)33 with the same color code used for panel B.

