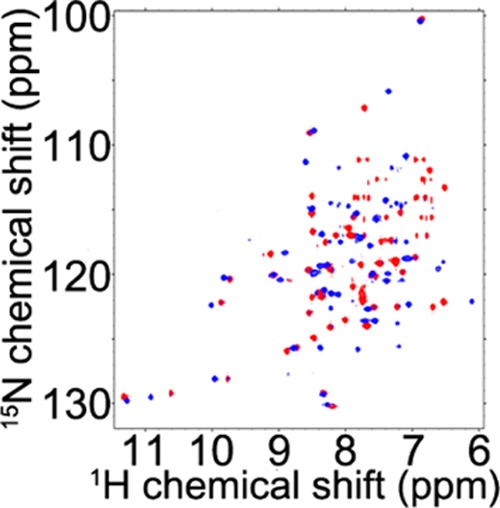
Figure 7.

2D 15N- HSQC spectrum of [U-15N]-IscX in the presence of 3 equiv of ferrous ion (red) overlaid with the 2D 15N-TROSY-HSQC spectrum of [U-15N]-IscX in the presence of 3 equiv of ferrous ion following the addition of 3 equiv of unlabeled IscU (blue). Note that the blue spectrum is different from those of [U-15N]-IscX alone (Figure 4A, red), Fe2+:[U-15N]-IscX (Figure S6D, purple), or [U-15N]-IscX–IscU (Figure 4A, blue).
