
Figure 1.
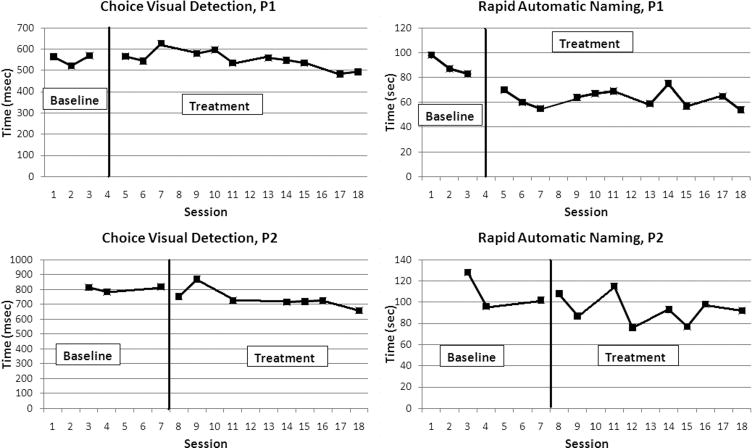
Results of timed repeated measures tasks. Upper graphs show performance across time for the first participant (P1) and lower graphs show performance for second participant (P2). The vertical black line on each graph indicates the start of the intervention phase. Improvement on the timed tasks is indicated by lower scores or lines with negative slope.