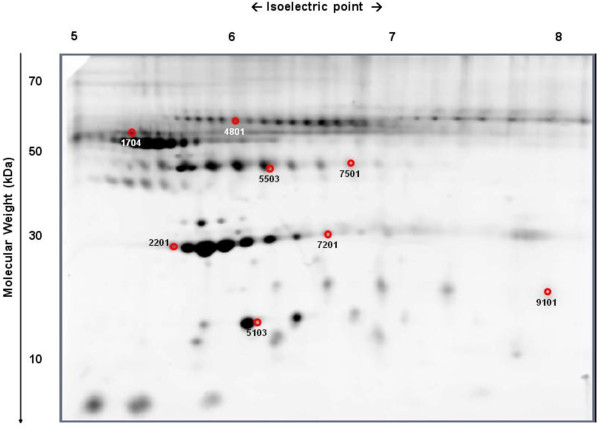
Figure 3.

Proteomic profile comparison in Pros-OB: D vs. WL. Protein identification of spots displaying intensity differences (p < 0.05) in obese children (Pros-OB) between baseline (D) and after extensive BMI reduction (WL). For the spot identification, please see Table 4.
