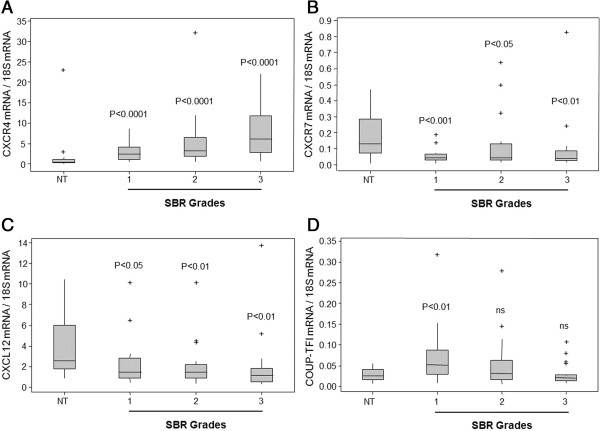
Figure 6.

Box plots of CXCR4, CXCR7, CXCL12, and COUP-TFI mRNA expression in breast cancer and normal tissue. CXCR4 (A), CXCR7 (B), CXCL12 (C), and COUP-TFI (D) mRNA expression was measured by real-time PCR in 23 normal breast tissue samples (NT), in 20 SBR grades 1 and 2, and in 19 SBR grades 3. The expression level was normalized by 18S RNA expression and analyzed with IQ5 software (Bio-Rad). The data are presented as whisker plots in which the horizontal bar represents the median, the grey boxes are the 25th and 75th percentiles, the vertical bar is the standard deviation, and the plus signs are the extreme points. All the Mann-Whitney tests were performed with Minitab 16 software, and the p value is indicated on the different graphs (ns denotes non-significant).
