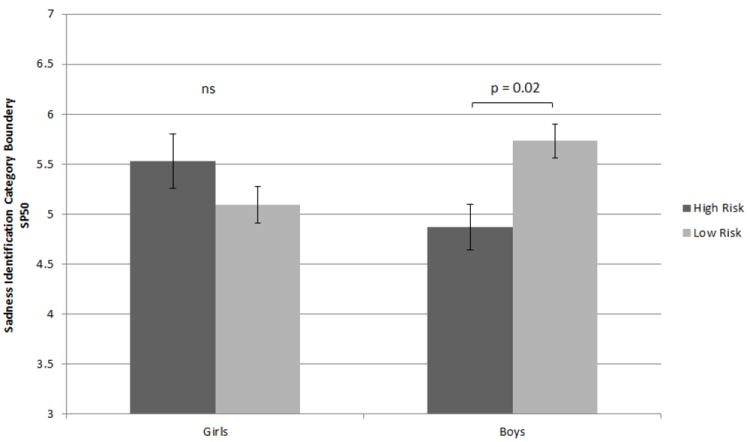
Figure 2.

Mean difference in sadness identification category boundary among high- and low-risk boys and girls. Lower scores in SP50 represent higher perceptual sensitivity to subtle sad cues. Mean differences between high-risk boys and both low and high-risk girls were not significant. Error bars represent standard errors.
