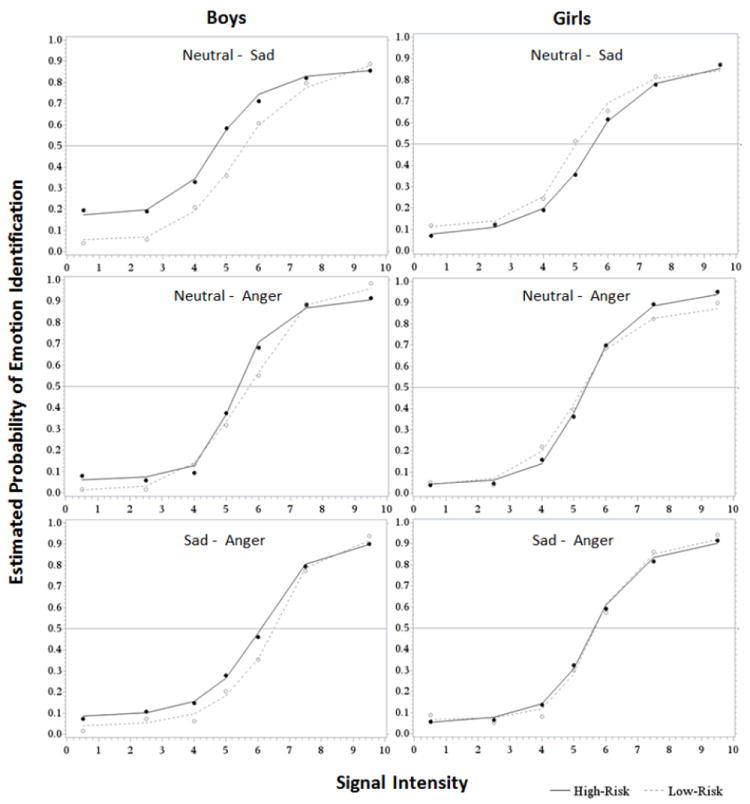
Figure 3.

Results from emotion identification and discrimination task by sex and risk status. The Y axis refers to the probability that the target emotion would be identified relative the alternative choice. The target emotion is presented on the right for each choice pair. The X axis refers to the intensity of the target emotion relative to the alternative choice. For the emotion identification tasks (i.e., neutral vs. sad and neutral vs. anger) the X axis refers to the intensity of the motion. For the emotion discrimination task (i.e., sad vs. anger) the X axis refers to the intensity of anger relative to the intensity of sadness. For example, a signal strength of 9 = 90% anger and 10% sadness.
