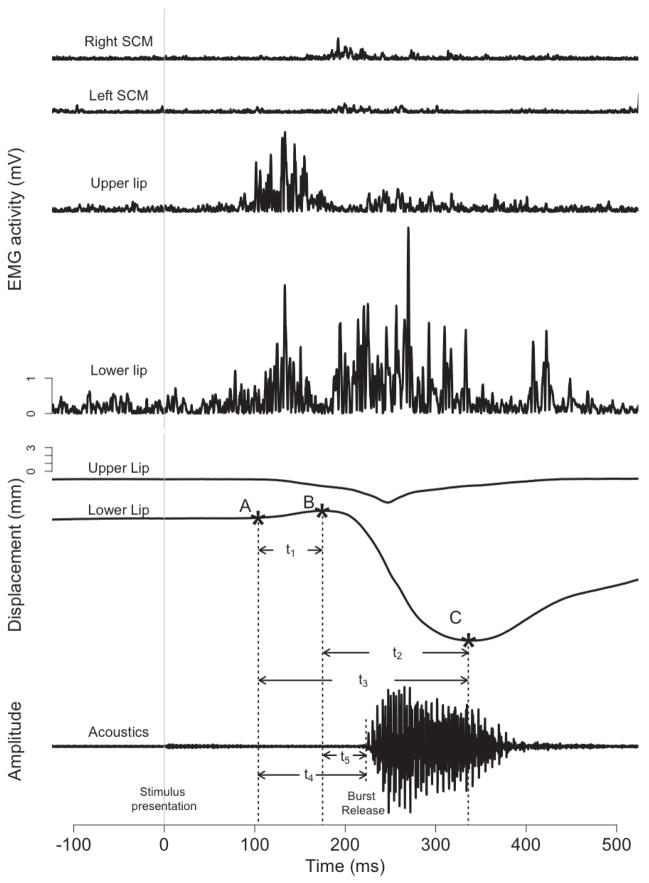
Figure 4.
EMG activity, lip displacement and response acoustic waveforms of exemplar control trial. The EMG measures include (from top) right SCM, left SCM, upper lip, and lower lip. EMG activity was rectified and plotted with respect to the imperative stimulus (the vertical grey line). Upper and lower lip displacement and response acoustic waveforms are also plotted with respect to the imperative stimulus. Point A marks the beginning of voluntary movement; point B marks the time to the lower lip opening onset; point C marks the lowest position of the lower lip.

