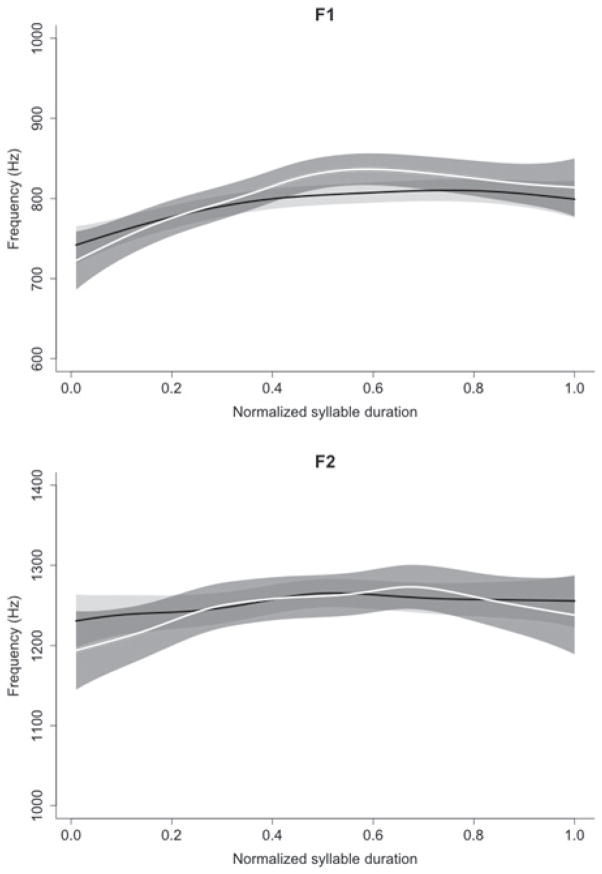
Figure 7.
SSANOVA comparison of formant frequencies F1 (top panel) and F2 (bottom panel) over syllable “[ba]” durations. Shading around the black (control responses) and white (startle responses) lines represents a 95% confidence interval. Note the similarity of the format frequencies, confirming a similar acoustic response in both control and startle trials.

