Fig. 3.

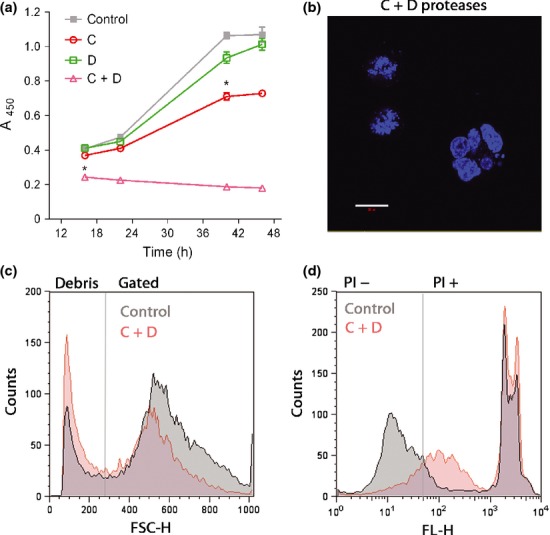
Time course of botulinum-triggered cytotoxic effects. (a) A late onset of toxicity observed following application of type C, type D, and C and D proteases. A significant (*p < 0.01) reduction in cell viability is observed at 16 h post-transduction for the combined C and D protease, whereas a significant (*p < 0.01) reduction in the type C protease-treated cells can be observed after 40 h. Results are presented ± SD. (b) Confocal image showing fragmented nuclei of N2A cells treated with the C and D proteases, indicating apoptosis. White bar: 20 μm. (c) Histogram of the forward scatter height (FSC-H) observed by flow cytometry. The gated region on the right contained morphologically normal (i.e., size and complexity) cells, whereas the left section shows the cell debris. Botulinum protease-treated cells (red) exhibit higher debris count compared with control (gray) (p < 0.05). (d) Histogram representation of FL-H (fluorescent height) signal of the propidium iodide (PI)-stained morphologically normal cells indicates a significant increase in cell death following application of botulinum proteases (p < 0.01).
