
Fig. 2.
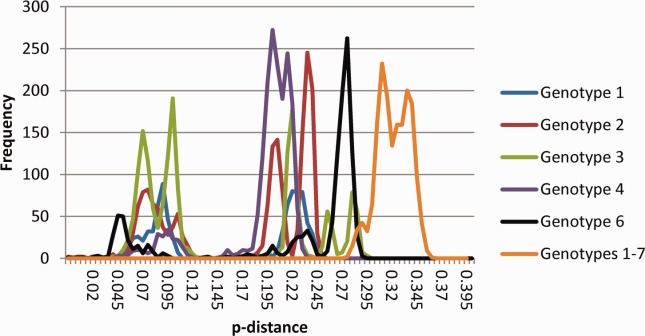
Distribution of p-distances between complete coding region sequences. The frequency of p-distances was calculated within and between genotypes using SSE.12 Intra-genotype pairwise distances were calculated for all available complete coding region sequences except for subtypes 1a, 1b, and 2b where 20 random sequences were used. For p-distances >0.15 (equivalent to a percent difference of 15%), frequencies were scaled to reduce the maximum frequency to less than 300. Distances between genotypes were calculated using one or two representatives of each confirmed and unassigned subtype, with the frequencies scaled as above.