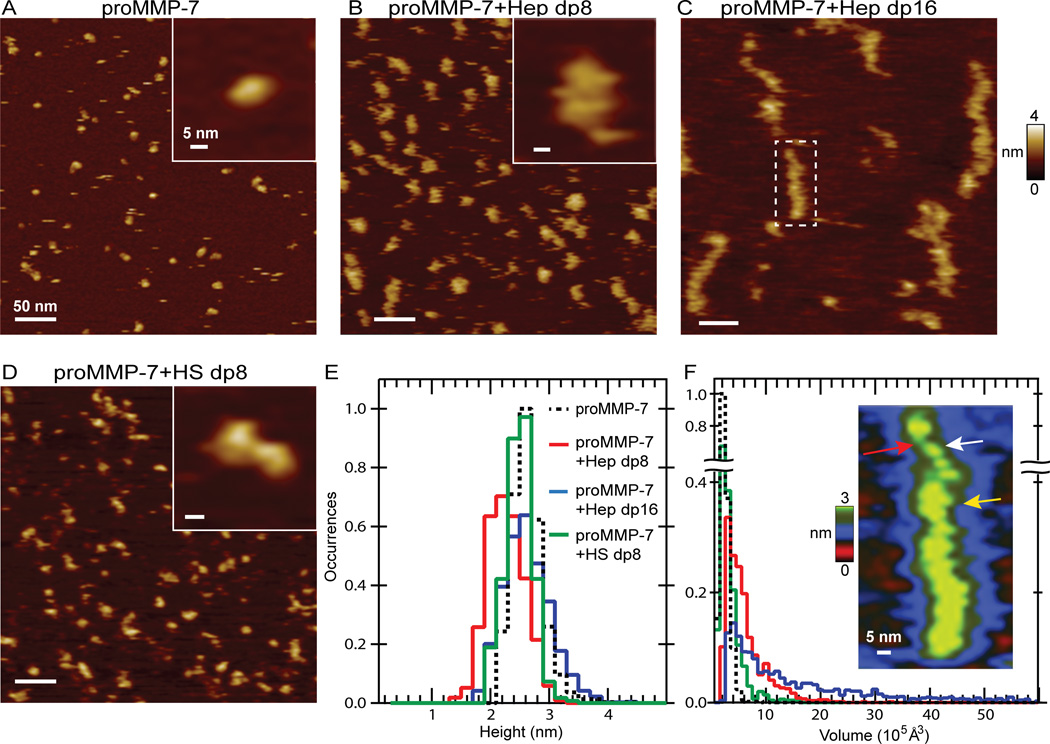
Figure 3. Atomic force microscopy (AFM) reveals tethering of proMMP-7 molecules by heparin oligosaccharides that becomes extensive with lengths of 16 monosaccharide units.
400×400 nm AFM images are shown for (A) proMMP7-E195A (100 nM) only or (B) 50 nM zymogen with 100 nM Hep dp8, (C) 100 nM zymogen with 100 nM Hep dp16, or (D) 50 nM zymogen with 100 nM HS dp8. Insets show enlargements. (E) The maximum heights of proMMP-7-E195A in the free state or with Hep dp8 or dp16 oligosaccharides present are tabulated as histograms with bins of 2 Å. In E and F, the black dashed line represents proMMP-7-E195A only (N = 903 features), red the mixture with Hep dp8 (N = 980), blue with Hep dp16 (N = 1379), and green with HS dp8 (N = 826 features). (F) Volumes of the same features are tallied into bins of 1×10⁵ Å3 in the histogram. The inset of (F) expands the boxed feature from panel C. The red arrow marks an apparent Hep dp16 chain. The white arrow marks a width of one enzyme while the yellow arrow marks a width of two enzymes.

