Fig. 3.
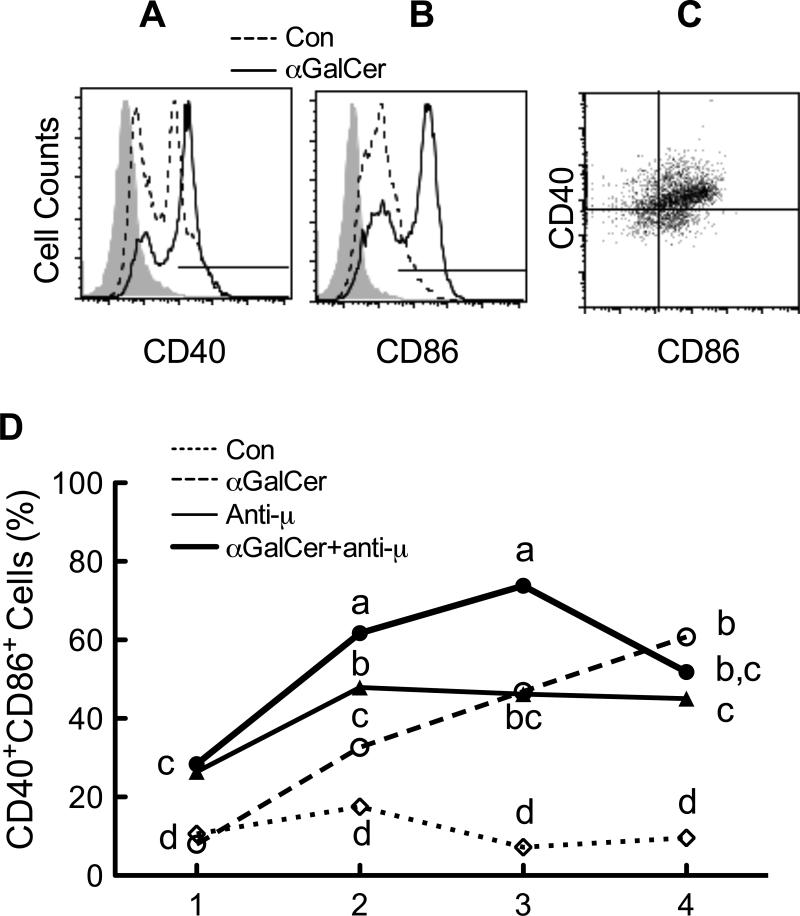
αGalCer and anti-μ increased the co-stimulatory molecules CD40 and CD86 on B cells. Splenocytes were cultured in the presence and absence of RA (20 nM), anti-μ (1 μg/ml) and/or αGalCer (100 ng/ml) at 5 × 10⁵ cells/0.5 ml in 48-well plates for a total of 4 days. Cells were harvested each day and subjected to flow cytometric analysis. Cells were first gated on CD19 and IgD positive cells, and then analyzed for CD40 and CD86 positive cells. A and B, Representative histograms showing the CD40 and CD86 expression on CD19+-IgD+ B cells after 2 days of culture and treatment. The negative control is shown in filled grey from cells stained with isotype control antibody, cell treated with medium only by the dashed line, and cells treated with αGalCer by the solid line. C. CD40 and CD86 double positive B cells are shown in the upper right quadrant, a representative graph from cells treated with αGalCer and anti-μ for 2 days. D. CD40 and CD86 double positive cells were increased after stimulation. The data shown are representative of three independent experiments, each performed in triplicate. Data were analyzed using a two-way ANOVA followed by Bonferroni post hoc test. Groups with different letters differed significantly, a>b>c>d, P < 0.05.

