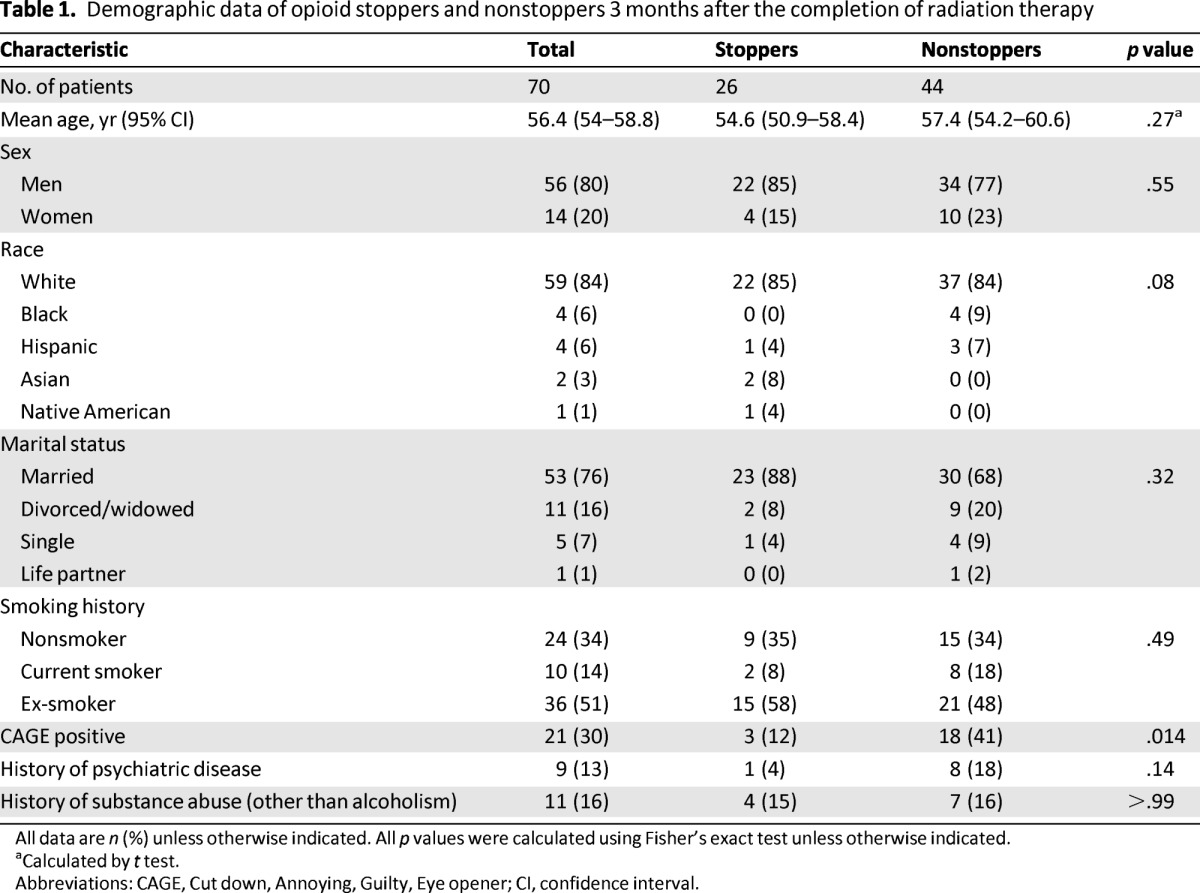
Table 1.
Demographic data of opioid stoppers and nonstoppers 3 months after the completion of radiation therapy

All data are n (%) unless otherwise indicated. All p values were calculated using Fisher's exact test unless otherwise indicated.
aCalculated by t test.
Abbreviations: CAGE, Cut down, Annoying, Guilty, Eye opener; CI, confidence interval.
