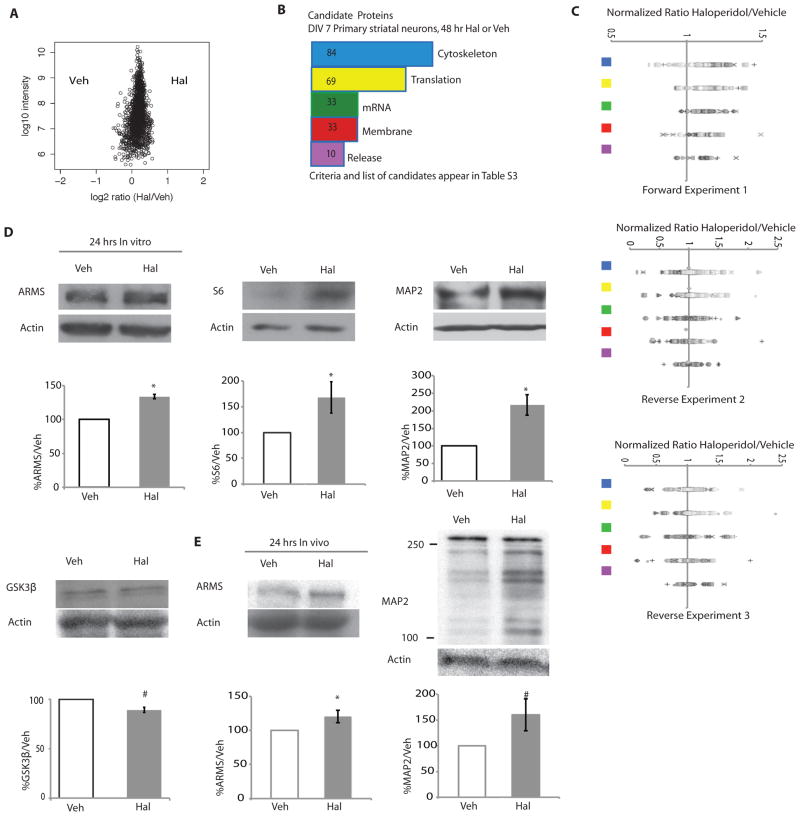
Figure 3. Haloperidol treatment leads to specific early proteomic changes in proteins involved in protein synthesis and associated with the cytoskeleton.
(A) A representative plot of all normalized proteins measured by mass spectrometry after 48 hours of haloperidol or vehicle treatment and SILAC labeling. (B) Bioinformatic analysis of the candidate proteins that increased with haloperidol treatment in the 48-hour mass spectrometry assays. The plot shows the frequency of proteins abundance changes of the top five categories from UniProtKB (see Materials and Methods, table S4). Translation= proteins related to protein translation; mRNA= proteins related to synthesis and trafficking of mRNA; cytoskeletal= proteins related to or part of the cytoskeleton; membrane= proteins integral to the plasma membrane; release= proteins related to synaptic vesicle release or synaptic exocytosis. (C) Normalized fold changes for all proteins in top 5 candidate protein classes. The symbols do not denote any special meaning. The colored squares correspond to the classes as colored in B. (D) Western blot analysis of lysates of DIV7 striatal neurons exposed to haloperidol or vehicle for 24 hours. The candidate proteins S6 (n=4, p =0.06), ARMS (n=3, p <0.0001), and MAP2 (n=3, p= 0.02) were analyzed, as well as GSK3β, a protein that was not a candidate (n=4, p=0.006). (E) Western blot analysis of ARMS and MAP2 in striatal lysates from adult mice treated with either 0.25 mg/kg haloperidol or vehicle for 24 hours. ARMS (n=6/group, p = 0.048); MAP2 (n=6/group, p= 0.08). All graphs shown are average ± SEM and analyzed by Student’s t test. P < 0.05 was considered significant and is marked with asterisks; p < 0.1 is considered trend level and is marked with #.

