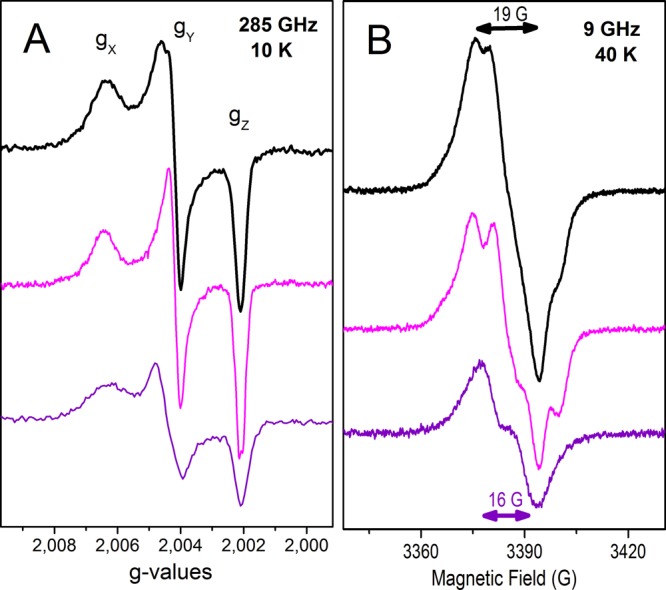
Figure 1.

(A) 285 GHz and (B) 9 GHz EPR spectra of Tyr radicals formed in the W191F (top, black), W191F/W51F (middle, magenta), and W191F/W51F/Y187F/Y229F/Y236F (bottom, purple) variants of cytochrome c peroxidase upon reaction with a 2-fold excess of hydrogen peroxide, using a mixing time on ice of 10 s. (A) The 285 GHz spectra (shown in g scale) were recorded at 10 K, using a frequency modulation of 30 kHz; a field modulation of 5 G was used for the top and middle spectra, while a field modulation of 10 G was used for the bottom spectra because of the much lower radical yield. The top and middle spectra result from averages of four scans, while 10 scans on average were used for the bottom spectrum. (B) The 9 GHz spectra (top and middle) were recorded at 40 K, with a modulation amplitude of 1 G, a microwave power of 0.08 mW, and a modulation frequency of 100 kHz. For the bottom spectrum, a modulation amplitude of 3 G and a microwave power of 0.2 mW were required because of the much lower radical yield.
