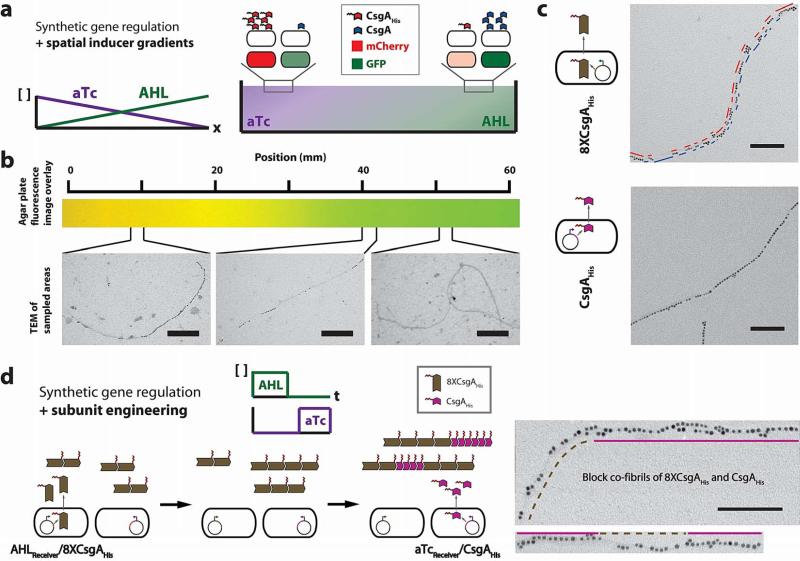
Figure 4. Multiscale patterning with cellular consortia via synthetic gene regulation combined with inducer gradients and subunit engineering.
a, Synthetic gene circuits that couple curli subunit secretion to external inducer signals, when combined with a spatial inducer gradient, enable patterning across multiple length scales. We used an agar plate with opposing concentration gradients of AHL and aTc to achieve control at the macroscale (Supplementary Fig. 12). This was combined with regulation of nanoscale patterning to achieve multiscale patterning. Embedded in top agar were equal numbers of AHLReceiver/CsgA, aTcReceiver/CsgAHis, AHLReceiver/GFP, and aTcReceiver/mCherry cells. b, By combining synthetic gene regulation with spatial inducer gradients, we created a change in the nanoscale structure of fibrils across a distance of millimetres. This nanoscale and macroscale patterning was shown by changes in segment lengths of unlabelled and NiNTA-AuNP-labelled fibril segments at different locations across the agar plate. Inducer concentration gradients were demonstrated by overlaid GFP and mCherry fluorescence images of embedded AHLReceiver/GFP and and aTcReceiver/mCherry reporter cells. Scale bars are 200nm. c, We also achieved patterning at the nanoscale by protein engineering of curli subunits. Concatenating eight tandem repeats of CsgA and adding one histidine tag to the C-terminus (8XCsgAHis) resulted in fibrils that were labelled by a syncopated pattern of NiNTA-AuNPs, with clusters of particles separated by 33.3±27.1 (s.e.m.) nm. Scale bars are 100nm. d, Synthetic gene circuits that couple curli subunit secretion to external inducer signals, when combined with subunit engineering, enable patterning across multiple length scales (nanometres to micrometres). We used AHL to induce production of 8XCsgAHis from AHLReceiver/8XCsgAHis and then used aTc to induce production of CsgAHis from aTcReceiver/CsgAHis. In the TEM images, dashed brown lines refer to syncopated 8XCsgAHis segments while the solid amethyst lines indicate CsgAHis segments. Detailed histograms for data shown here can be found in Supplementary Figure 11. Scale bars are 100nm.

