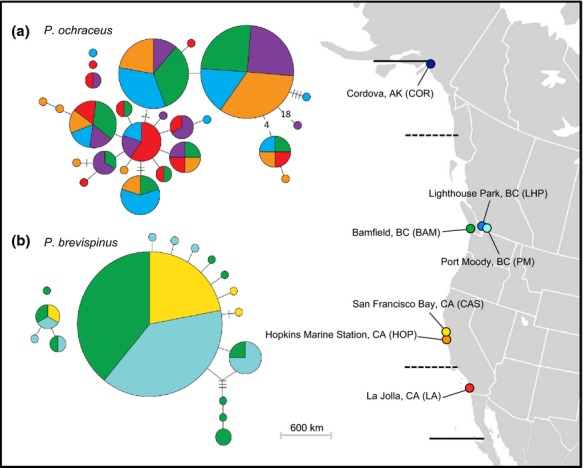
Figure 1.

Collection sites for five Pisaster ochraceus and three Pisaster brevispinus populations sampled in this study are shown on the map on the right. Dashed lines represent the northern and southern range boundaries for P. brevispinus. Solid lines represent the range boundaries for P. ochraceus. Refer to Table 1 for exact localities and sample sizes. Bindin haplotype networks for (a) P. ochraceus and (b) P. brevispinus are shown on the left. Each circle represents a unique haplotype; the area of the circle is proportional to the frequency of the haplotype; colors show the proportion of each haplotype from different localities shown on the map. Each line between haplotypes represents one inferred mutational step, slashes indicate an additional mutation, and numbers within lines specify the number of additional mutational steps >3. Isolated haplotypes represent alleles that differed from the rest of the sample by insertion–deletion differences and could not be connected to the rest of the haplotype network by nucleotide substitutions only.
