Figure 3.

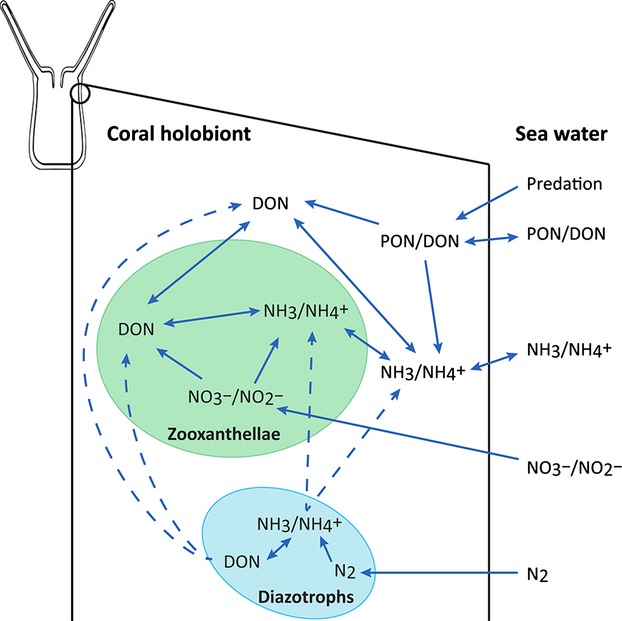
Schematic illustration of the N cycle in the coral holobiont. Solid lines represent nutrient transfer and pathways that have been shown to occur, while dashed lines represent hypothetical fluxes.

Schematic illustration of the N cycle in the coral holobiont. Solid lines represent nutrient transfer and pathways that have been shown to occur, while dashed lines represent hypothetical fluxes.