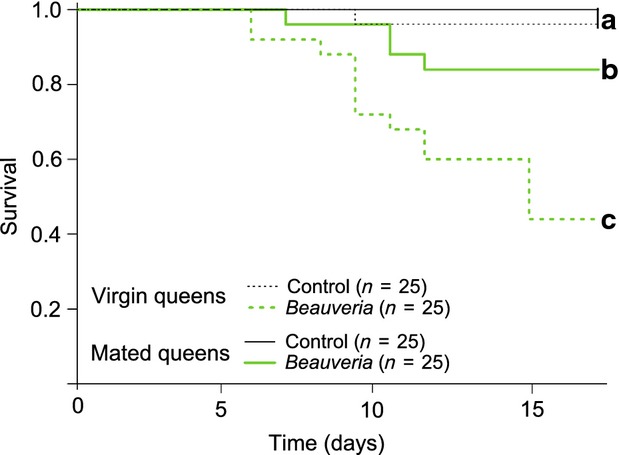
Figure 3.

Test of the effect of mating on immune resistance in L. niger queens. The figure shows Kaplan–Meier survival curves for virgin queens (dashed lines) and mated queens (continuous lines) that were either exposed to control solvent (Control, black thin lines) or to a high dose of the entomopathogenic fungus B. bassiana (Beauveria, light green bold lines). No prior exposure (priming) was performed in this experiment. Sample sizes (number of queens) for each treatment are indicated in brackets. Different lower case letters indicate treatments that differed significantly from one another.
