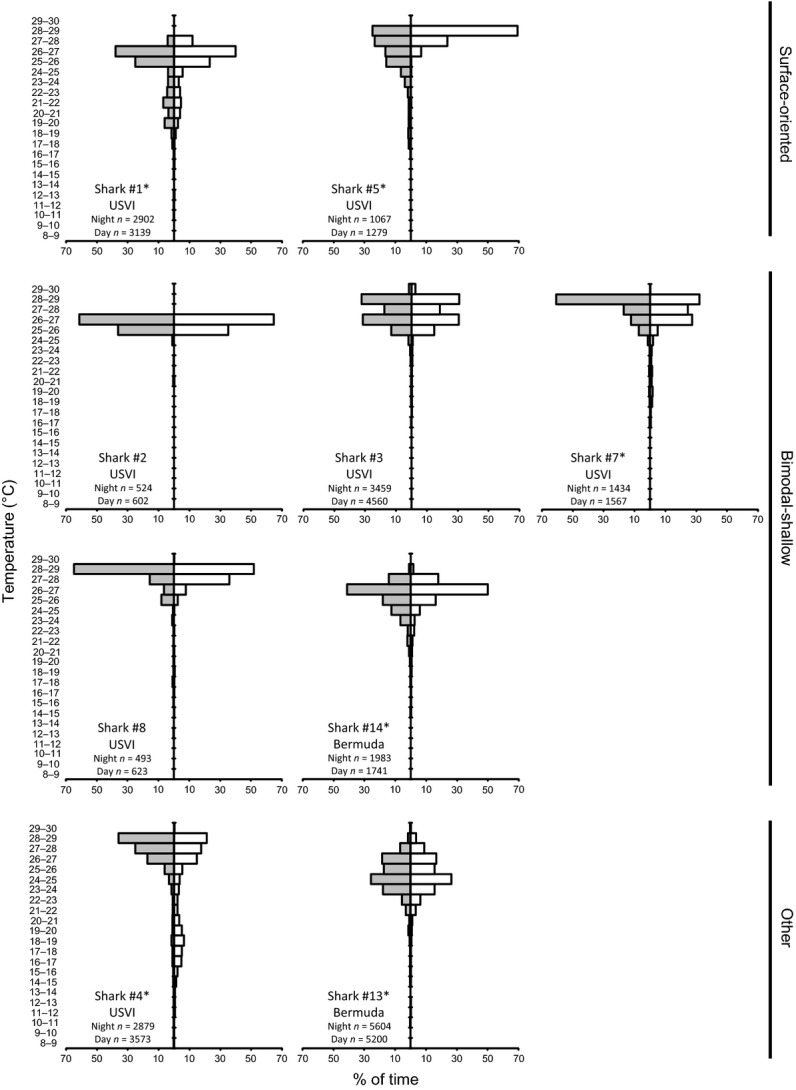
Figure 5.

Daytime (white) and nighttime (gray) temperature distributions of tiger sharks by behavioral type. n is the number of temperature records. Asterisks indicate differences between daytime and nighttime distributions subsampled to account for autocorrelation (two-sample Kolmogorov–Smirnov test, P < 0.05).
