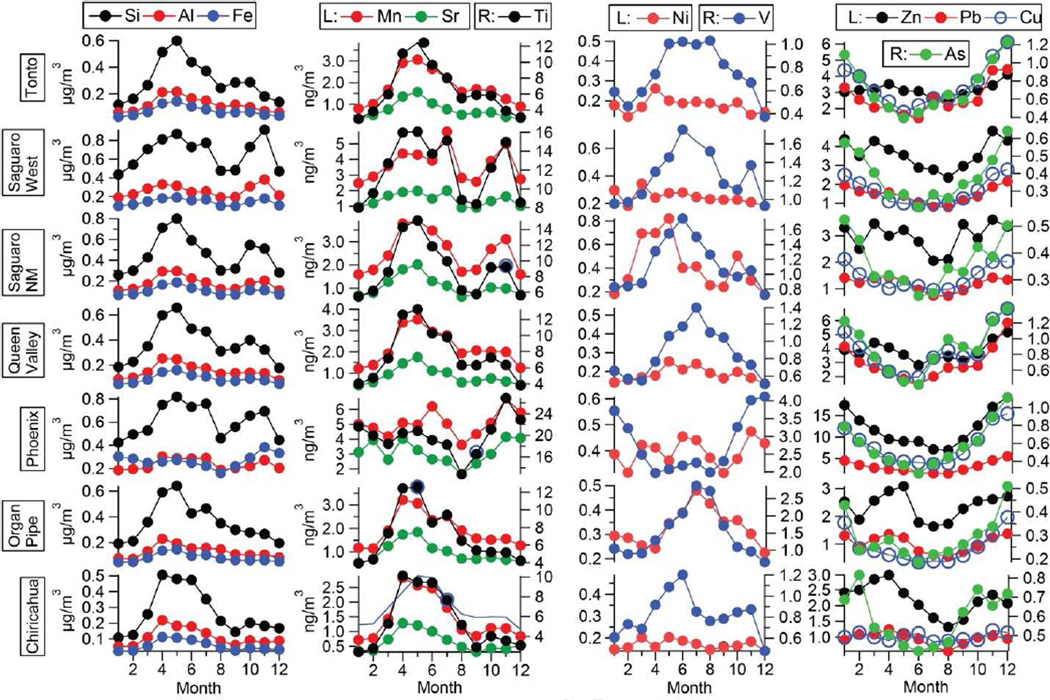
FIG 2.
Monthly-averaged mass concentrations (1 = Jan; 12 = Dec) of PM2.5 constituents at seven sites in southern Arizona between 2000 – 2009 (note though that for Queen Valley/Phoenix, Saguaro West and Organ Pipe, data are only available since 2001, 2002 and 2003, respectively). “L” and “R” denote the left and right y-axis, respectively.

