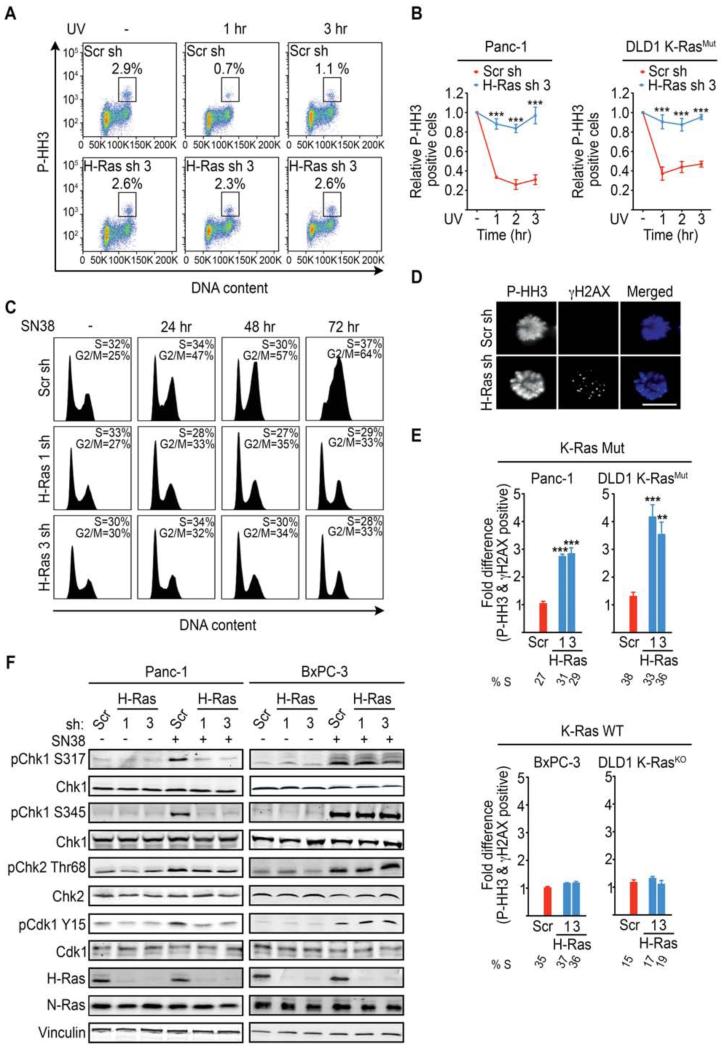
Figure 3. K-Ras mutant cancer cells selectively depend on WT-H-Ras for the activation of the ATR-Chk1 mediated G2 DNA damage checkpoint.
(A) Representative FACS plots showing the P-HH3-positive population in untreated (−) and (+) UV-C treated (at 1 hr and 3 hr post treatment) Panc-1 cells expressing scramble (Scr) or WT-H-Ras shRNA (n=3). The boxed area represents the % P-HH3-positive cells.
(B) Quantifications of the experiments described in (A) for K-Ras Mut cell lines. Data are presented as relative to the values obtained for the respective (scramble or WT-H-Ras shRNA) untreated cells.
(C) FACS histograms showing the cell cycle profile of WT-H-Ras-suppressed Panc-1 cells following SN38 (4 nM) treatment. The S and G2/M fractions are indicated. Data are representative of 3 independent experiments.
(D-E) K-Ras Mut and K-Ras WT cancer cells expressing the indicated shRNAs were treated with UV-C, placed in nocodazole containing media for 4 hr to trap mitotic cells, and co-stained for P-HH3 (Blue) and γH2AX (Green). Representative immunofluorescence images of mitotic DLD1 K-RasMut cells treated as indicated are shown in (D). Scale bar, 10μm. Quantifications of the fraction of mitotic cells (P-HH3) expressing the indicated shRNAs that are positive for γH2AX foci (>10 per cell) are shown in (E). Data are presented as relative to the values obtained for the scramble shRNA (Scr sh) cells. At least 50 mitotic cells were analyzed per experiment. S-phase percentages are indicated below the bar graphs.
(F) Representative immunoblots for the indicated proteins in mock or SN38 treated (4nM SN38 for 2h) Panc-1 (K-Ras Mut) and BxPC-3 (K-Ras WT) cancer cells are shown.
All experiments: error bars, mean ± SEM, n=3, **p<0.005, ***p<0.0005. See also Figure S3.

