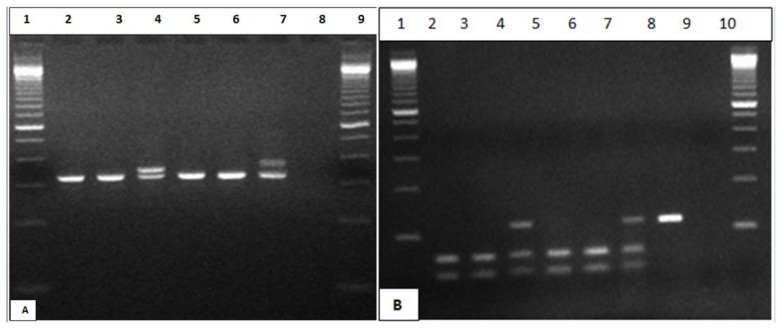
Figure 2.
PCR analysis of FLT3-ITD and D835 mutations. A) Agrose gel shows patients positive for ITD lanes 4, patients negative for ITD lanes 2, 3, 5, 6, positive control lane 7, no template control lane 8, Marker lane 1, 9. B) Agrose gel shows digested sample for D835 lanes 2–7, positive patients lane 4 (114bp, 68 bp, 49bp), negative patients lanes 2, 3, 5, 6 (68bp, 49bp), positive control lane 7, Undigested sample lane 8 (114bp), no template control lane 9, Marker lanes 1, 10.

