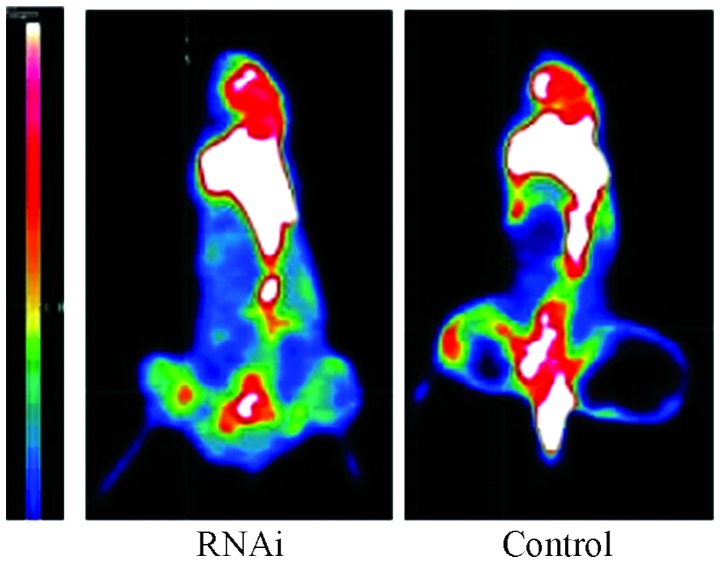
Figure 3.
Micro-positron emission tomography (PET) images of the two groups, with a color code indicating the glucose metabolism levels; red indicates high levels and blue indicates low levels (radioactive tracer, 18F-FDG). The bright white region is positively proportional to the uptake volume of 18F-FDG by the tumors in the region. The direct viewing of images demonstrated that the bright white regions in the lower extremities, ribs and spine were considerably larger in the control groups than in the interference group. 18F-FDG, 18F-fludeoxyglucose; RNAi, RNA interference.

