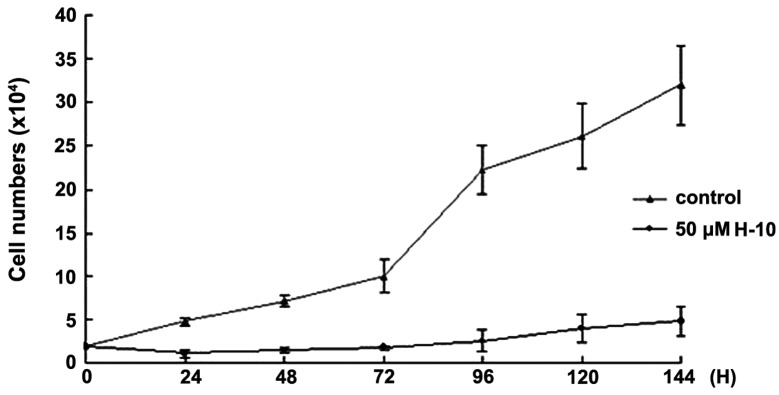
Figure 4.

Time-dependent effect of 50 μM H-10 on B16 cell growth. The upper line of the graph presents the control group without H-10 treatment and the bottom line presents the group treated with H-10. At the end of each time-period, the cells were trypsinized to produce a single cell suspension and the cell number was counted. Data are presented as the mean ± standard error of the mean.
