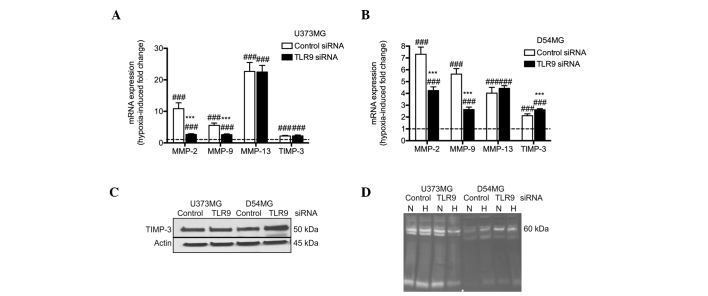
Figure 6.
(A) U373MG and (B) D54MG control and TLR9 siRNA cells were cultured for 24 h under normoxia or hypoxia, following which the expression of the indicated mRNAs was measured using quantitative polymerase chain reaction. Data are presented as hypoxia-induced changes relative to normoxia, as indicated by the dotted line (mean ± SD; n=6). ***P<0.001, vs. the corresponding values in normoxia; and ###P<0.001, vs. the corresponding control siRNA cells. (C) Western blot analysis of TIMP-3 protein expression in the same cells following 24 h of culture in hypoxia. Actin bands were used to indicate equal loading. (D) Zymograph results from the supernatants of the same cells cultured for 24 h in normoxia or hypoxia. TLR9, toll-like receptor-9; TIMP-3, tissue inhibitor of matrix metalloproteinases-3.

