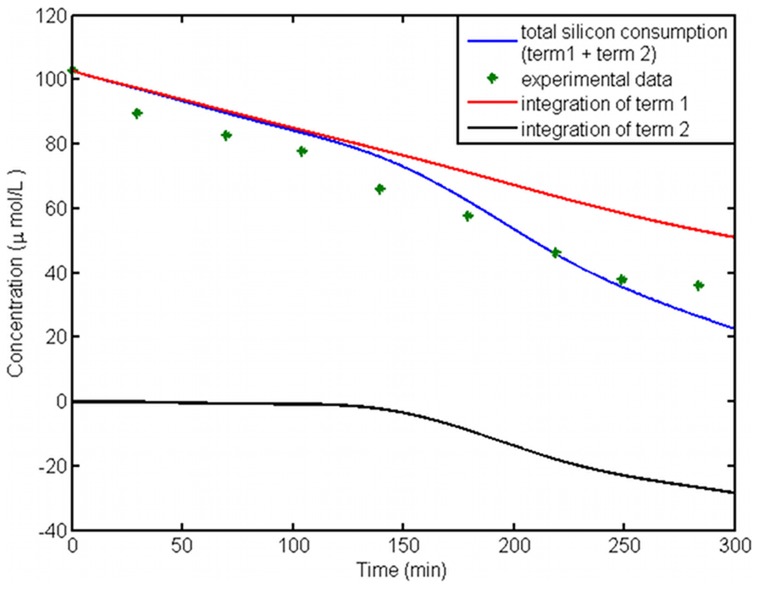
Figure 9. Silicon concentration in the medium – fitting to experimental data.
Data from the experiment and model output of silicon concentration in the culture medium is shown in points and a blue curve. This curve depicts the total silicon consumption by all cells. The red curve is the integration of uptake rate coming from term 1 in equation 5. After 150 minutes, the difference between this value and the total silicon consumption becomes big as a result of non-synchronized cell culture. Adding the black curve, integral of term 2, compensates for this difference.

