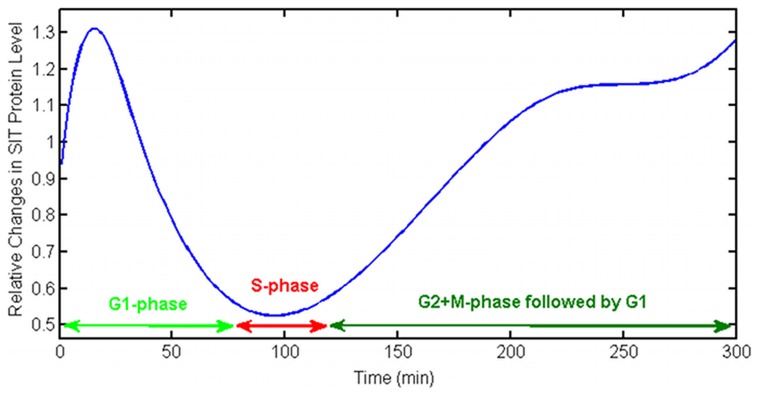
Figure 13. Protein flux used in the model.
The relative changes in SIT protein expression level during the cell cycle of diatoms that has been applied to the model. This curve is inferred using the data from the experiment [44 - Figure 3]. SITs are least expressed during S-phase when silicon deposition is almost stopped.

