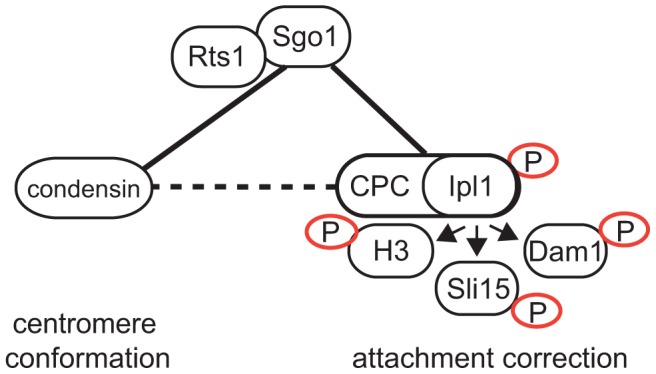
Figure 6. Model of Sgo1 function during establishment of biorientation.

Connecting lines represent protein-protein interactions, dashed lines represent functional interactions. Full arrow depicts phosphorylation.

Connecting lines represent protein-protein interactions, dashed lines represent functional interactions. Full arrow depicts phosphorylation.