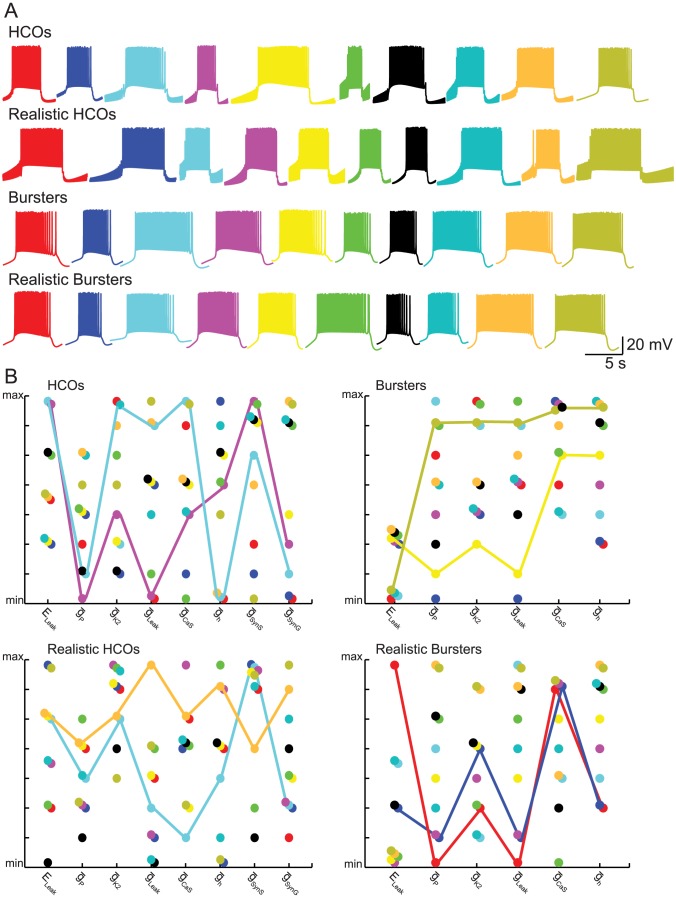
Figure 1. Activity and model parameters of ten instances, chosen at random from within each of the four groups defined in the text.
(A) One cycle period of the voltage trace of each of ten random instances from each group. (B) Parameter values of the ten instances in each group shown in panel A, with corresponding colors. A colored line connects the parameters of the same instance. The parameter values were normalized for uniform scaling. Lines show very different patterns of parameter values of two instances despite having similar activity. Notice that the HCO and the burster instances shown might include the instances that were classified as realistic (HCOs and bursters, respectively).

