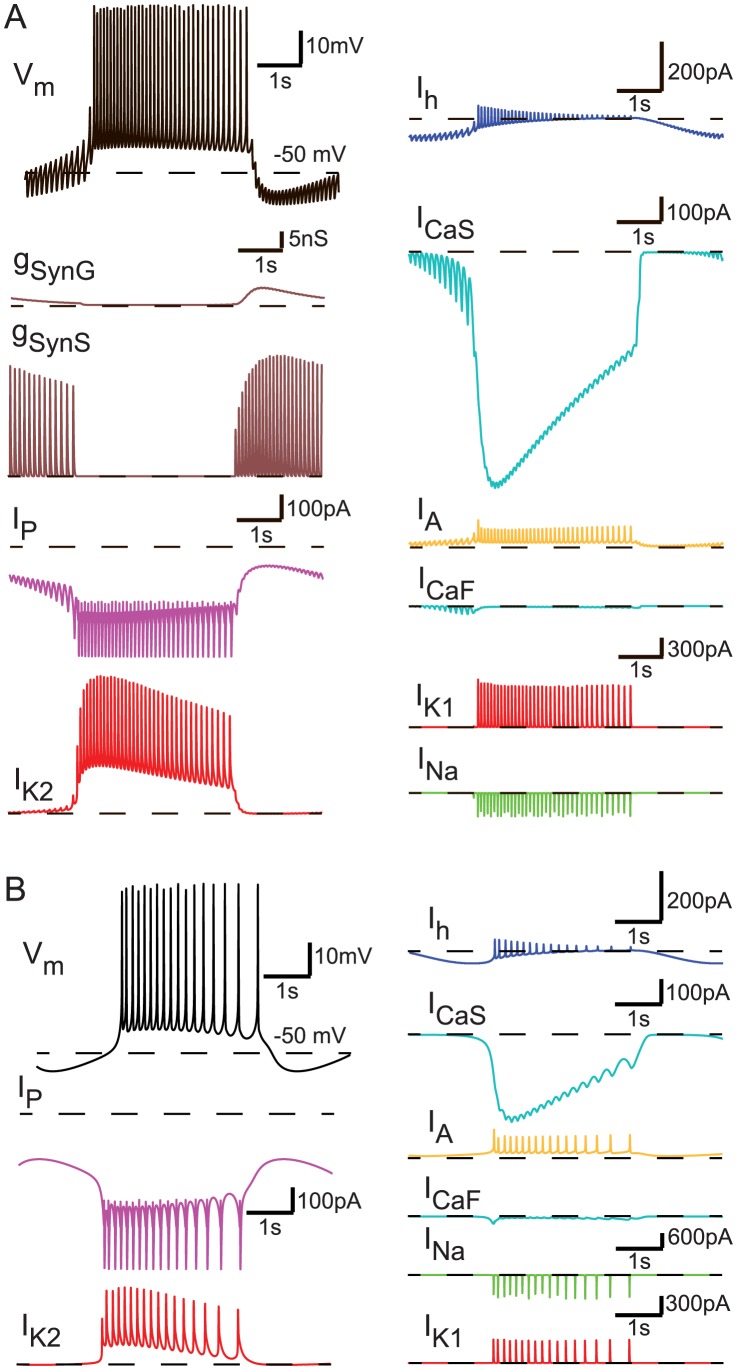
Figure 2. Intrinsic currents and synaptic conductances of two realistic instances presented in Figure 1.
The traces shown are color coded for easy comparison across the two instances. (A) Data corresponding to the realistic HCO instance colored in orange in Figure 1 ( ). (B) Data corresponding to the realistic burster colored in black in Figure 1 (
 ).
).

