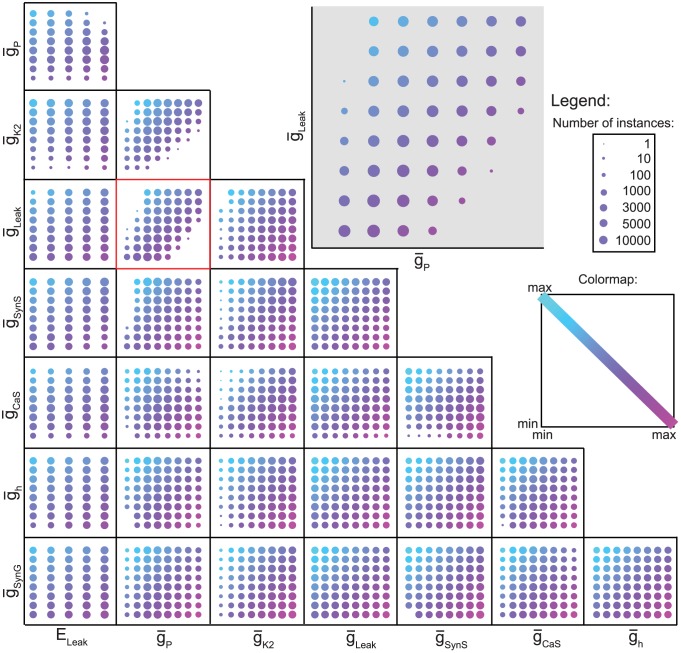
Figure 3. Pair-wise parameter variations for the realistic HCO instances.
Plot of all instances within the realistic HCO group projected onto the 2D space given by two parameters. The first parameter is shown on x axis. The second parameter is shown on y axis. Both parameters are color coded, using shades of magenta on x axis and of turquoise on y axis, from dark shades for low values (−70 mV for ELeak and 0% for the other parameters) to light shades for high values (−50 mV for ELeak.and 175% for the other parameters). The number of instances projected onto each point in the space is shown by the size of the circle surrounding it. To be able to visualize all the points (as there are many points with very few instances and many points with thousands of instances), we used the natural logarithm to adjust the size of the points (formula used:  , we added a value of 1 to be able to show a point with one instance on the plot). The legend shows the size of each point on the plot and its corresponding real number of instances. The highlighted subplot of
  Leak vs.
  P shows that there are exclusive zones of high
  Leak and low
  P and of low
  Leak and high
  P, which do not support realistic HCOs.

