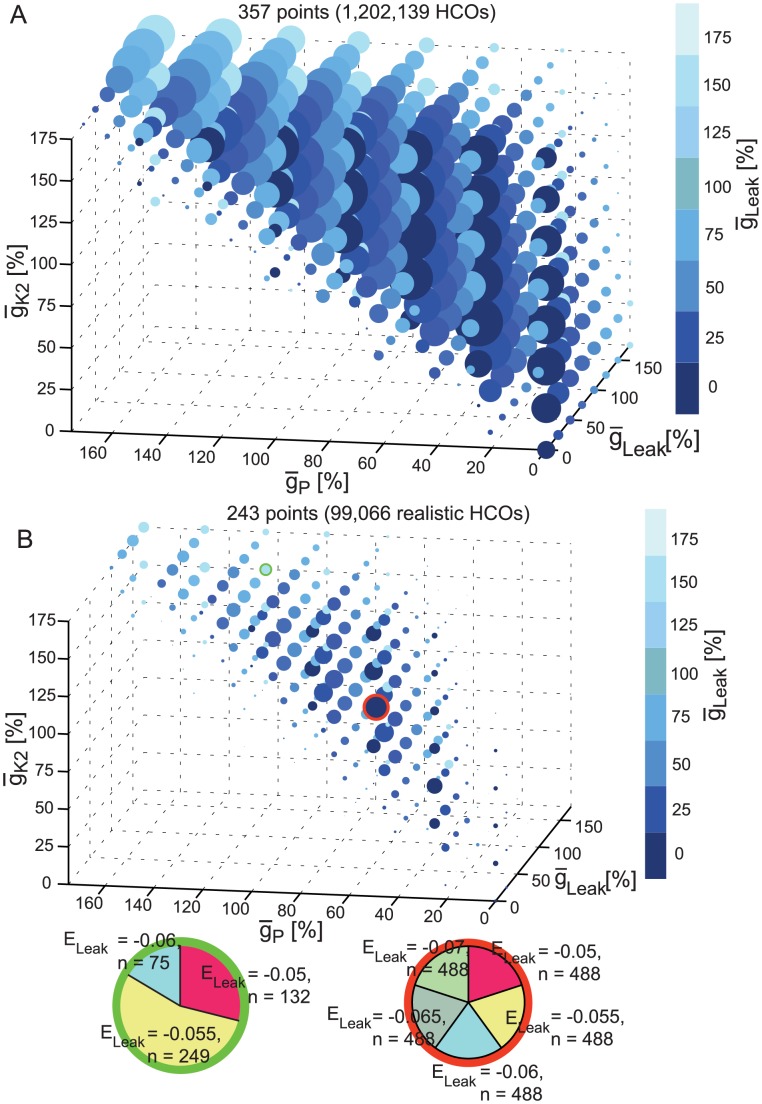
Figure 8. 5D clickable view of the HCOs and realistic HCOs.
(A) Plot of the HCO instances onto the 3D space given by the maximal conductances of IP, IK2 and ILeak. No clicked point is shown here. (B) Similar plot for the realistic HCO group. Each clicked point displays a pie chart of the ELeak reversal potential of all instances from the group having the same values of  P,
P,  K2, and
  Leak as the ones of the clicked point.

