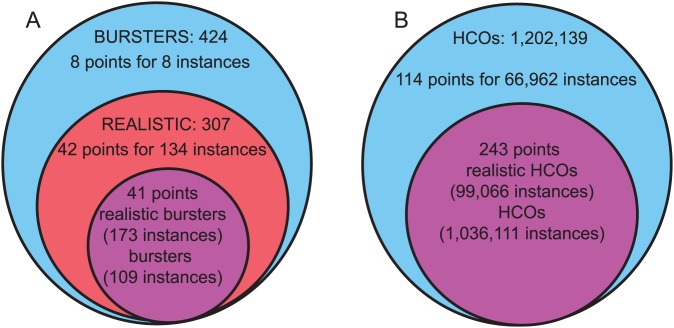
Figure 11. Venn diagram of the distribution of instances projected in the 3D space defined by  Leak,
Leak,  K2, and
  P.
P.
(A) Bursters and realistic bursters. The sets showing the number of points in the 3D space (shaded rectangles of Figure 10) that include only not realistic bursters (8), only realistic bursters (42), and both types of instances (41) are colored in light blue, red, and purple, respectively. (B) HCOs and realistic HCO instances. The sets showing the number of points in the same 3D space as Figure 8 (data not shown) that include only not realistic HCOs (114), and both types of instances (243), not realistic and realistic, are colored in blue, and purple, respectively.

