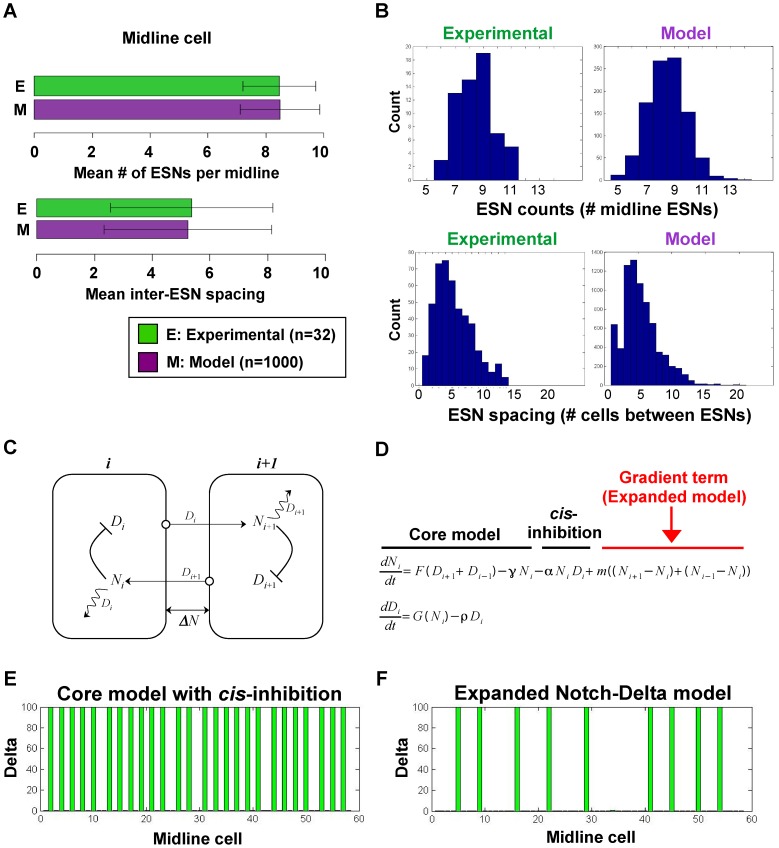
Figure 3. Expanded Notch-Delta model.
(A) Monte Carlo simulations show that our expanded model produces ESN numbers and spacings that match with experimentally determined values. (B) The distributions for the number and spacing of ESNs, including the minimum/maximum and variances of the distributions, are all very similar between model and experiment. For the top graphs, the y-axis shows the number of midlines with the given number of ESNs. For the bottom graphs, the y-axis shows the number of times a given ESN spacing occurs. (C) Schematic showing the intra- and inter-cellular interactions between Notch and Delta. The squiggle arrow represents cis-inhibition of Notch by Delta. Note that for clarity only two cells are shown, but the interactions extend over a linear array of cells. (D) The general form of the ordinary differential equations of our expanded model for Cell  , with addition of a Notch activity gradient term indicated in red. (E–F) Shown are the equilibrium values of Delta after a typical run of our expanded model in comparison with the original core model [12], [20].

