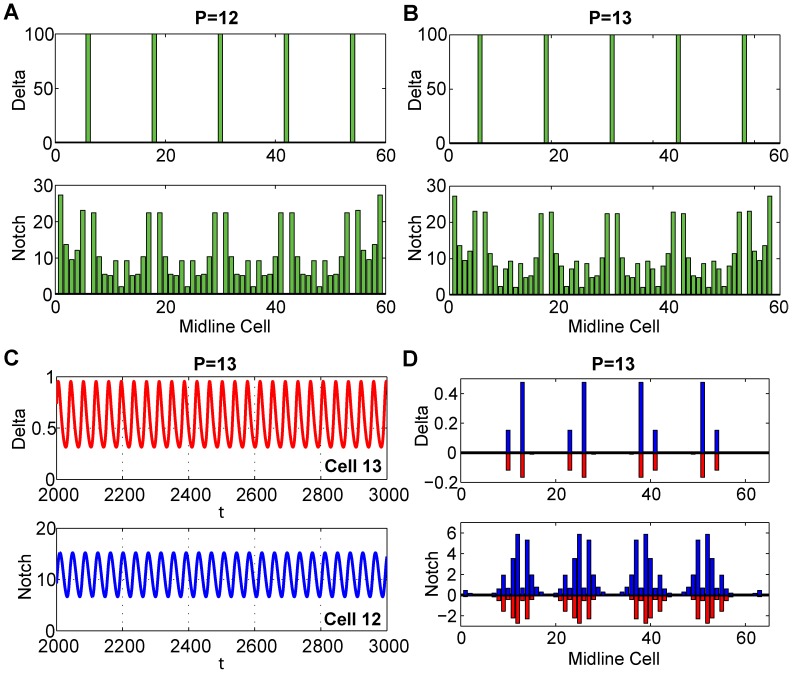
Figure 4. Stability analysis of the ESN spacing, P.
(A–B) The top graphs show the equilibrium values for the Delta and Notch levels. (C–D) The bottom graphs examine the unstable case  and show the time varying oscillations (left) of Cell 13 for
  and Cell 12 for
  and the variation from the equilibrium for all cells (right).

