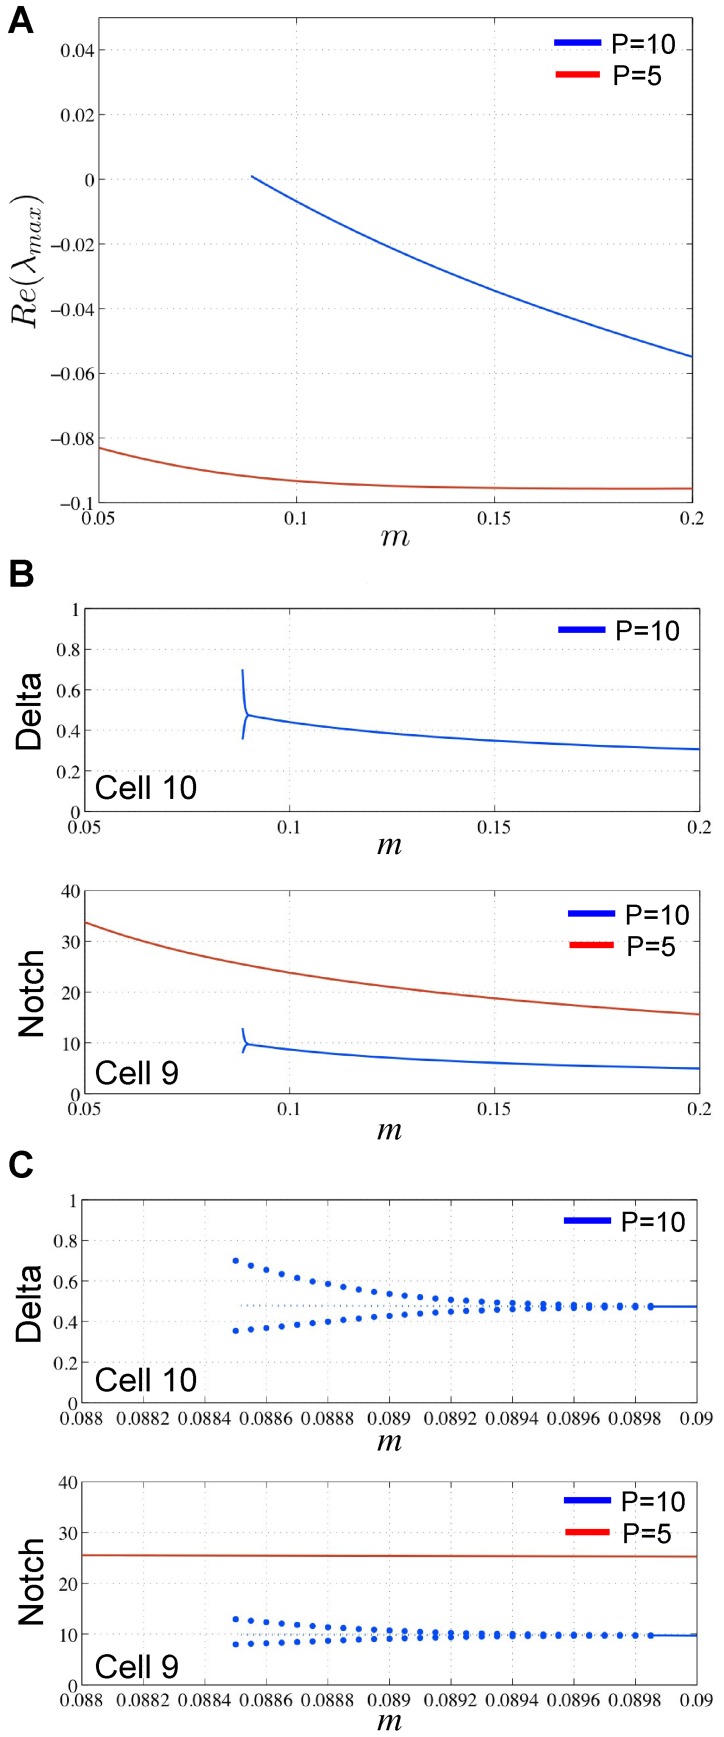
Figure 5. Stability analysis of the parameter m.
(A)  for
for  (blue) and
  as
as  varies. (B) The equilibrium levels of Delta (top) and Notch (bottom) for our cases
  (blue) and
  as
as  varies. (C) Extreme close-up of the graph in (B), showing the supercritical Hopf bifurcation with the stable oscillating periodic orbit.

