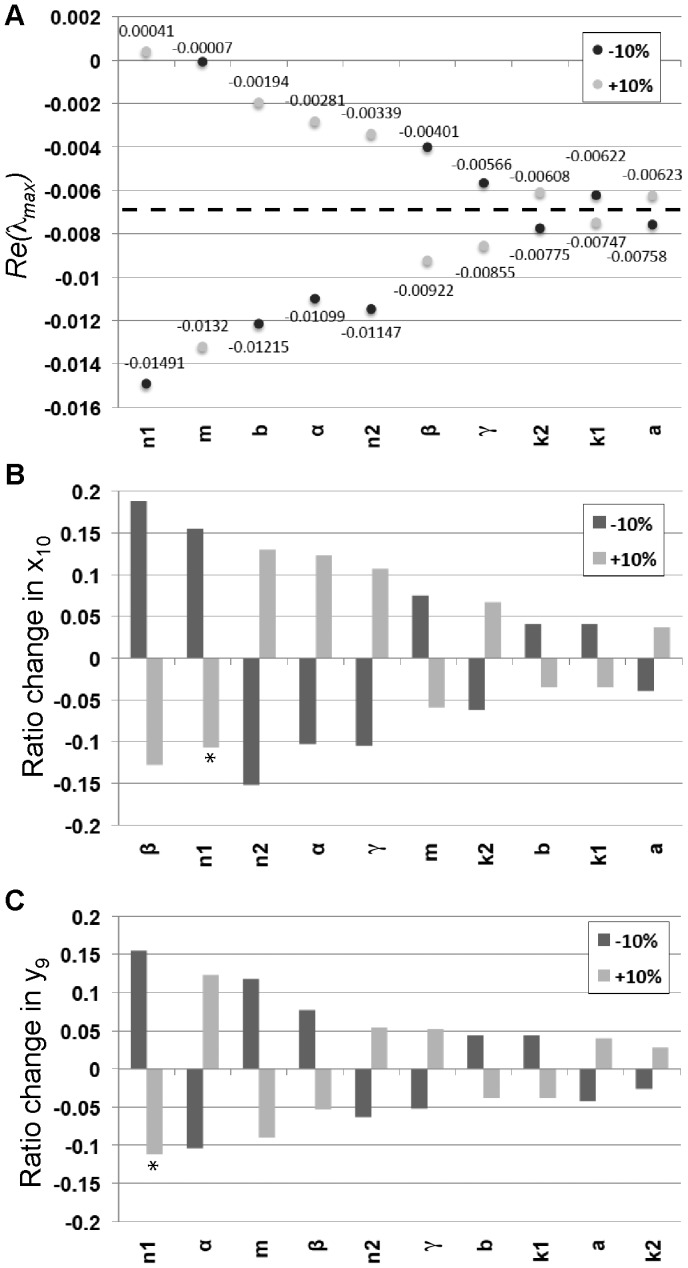
Figure 7. Parameter sensitivity analysis.
(A) The values of  are shown for all the parameters of the model with variations of
  % in each of the parameters. The ordering of the parameters shows which parameters had the largest increase in the eigenvalues for either a
  % change with the largest on the left. The dotted line indicates the value of
  for the original set of parameters used in Table 1. (B) The change in equilibrium value for
  after
after  % change in parameter values. The y-axis shows the ratio change of the equilibrium with the new parameter value divided by the original equilibrium value
  . The ordering of the parameters shows which parameters had the largest increase in the magnitude of
  for either a
  % change with the largest increase on the left. Since the equilibrium is unstable for
  ,
,  oscillates 17% above and 14% below the equilibrium marked with a
  . (C) The change in equilibrium value for
  after
after  % change in parameter values. The y-axis shows the ratio change of the equilibrium with the new parameter value divided by the original equilibrium value
  . The ordering of the parameters shows which parameters had the largest increase in the magnitude of
  for either a
  % change with the largest increase on the left. Since the equilibrium is unstable for
  ,
,  oscillates 13% above and 10% below the equilibrium marked with a
  .
.

