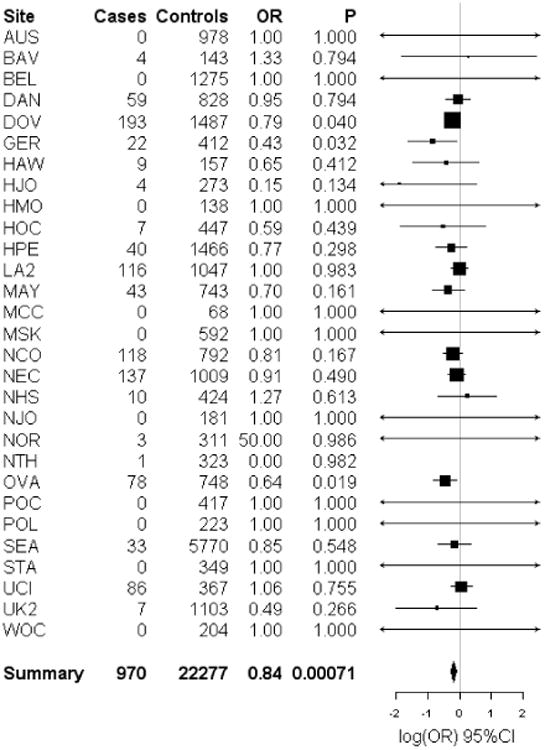
Figure 3.

Forest plot of the study specific and summary odds ratios and 95% confidence intervals for the association between low malignant potential serous ovarian cancer risk and one SNP nominated by our pool-based GWAS, rs9609538. Study-specific odds ratios, 95% confidence intervals, and P-values are based on logistic regression assuming an additive genetic model, adjusting for the first 5 eigenvalues from principal components analysis. Summary odds ratios and 95% confidence intervals are from fixed effects meta-analysis and include the OVA study site. Forest plots were generated using the rmeta library implemented in the R project; association analyses were performed using PLINK. The MDA and TOR study sites are not plotted; neither study had any LMP serous ovarian cancer cases or controls
