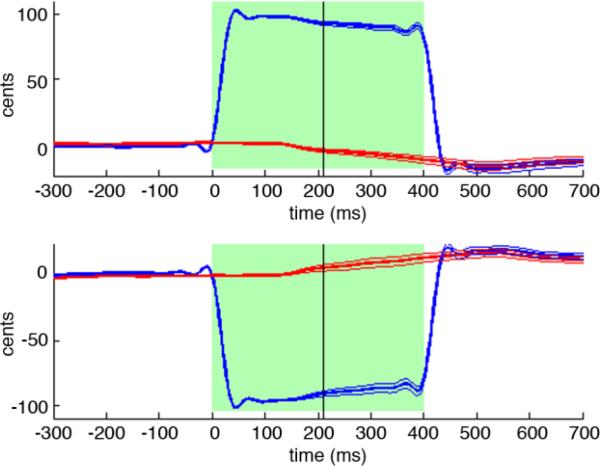
Figure 2.
Vocal responses to the pitch shifts of audio feedback. Upper and lower plots show time courses of the average subject response to the +100 cent and -100 cent pitch perturbations, respectively. In each plot, time is relative to perturbation onset at 0ms, and pitch is expressed in cents relative to the mean pitch of the pre-perturbation period. Green regions indicate the duration of the pitch perturbation. Blue traces show the mean time course of feedback heard by subjects, with thick blue line is the grand-average over subjects and flanking thin blue lines are +/− standard errors. In a similar fashion, red traces show the mean time course of the pitch produced by subjects. The black vertical line denotes the mean time when the subjects’ mean pitch time course deviates from the baseline by two standard deviations.

