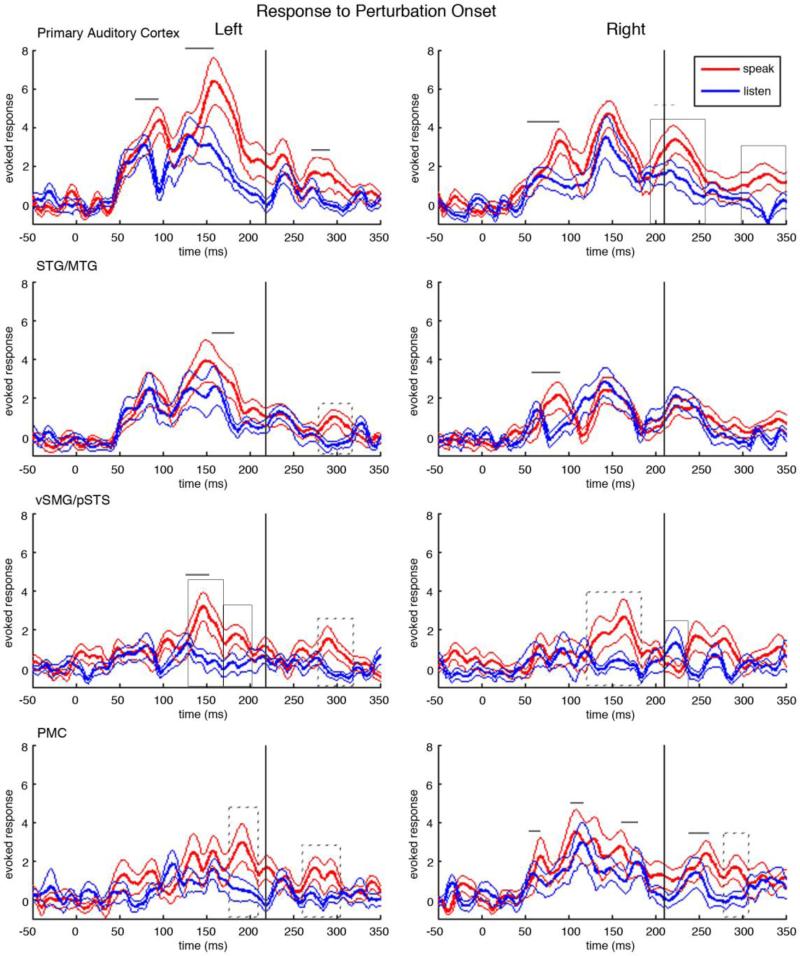
Figure 4.
Neural responses to the pitch-shifted feedback in both the speaking and the listening condition. In each plot, time is relative to the onset of the pitch-shifted feedback at 0ms. Red traces show the mean cortical responses at the corresponding anatomical location across all subjects in the speaking condition. The thick red line is the grand-average over subjects and the flanking thin red lines are the standard error bars. Blue traces show the mean cortical responses in the listening condition. The thick blue line is the grand-average over subjects and the thin blue lines are the standard error bars. Solid boxes surround peaks with a significant magnitude difference between speaking and listening, p< 0.0096, dotted boxes surround peaks with p<0.05. Similarly, solid lines mark significantly different latencies of peaks between speaking and listening, p< 0.0096, and dotted lines mark peaks with p<0.05. The black vertical line denotes the mean time when the subjects’ mean pitch time course deviates from the baseline by two standard deviations.

